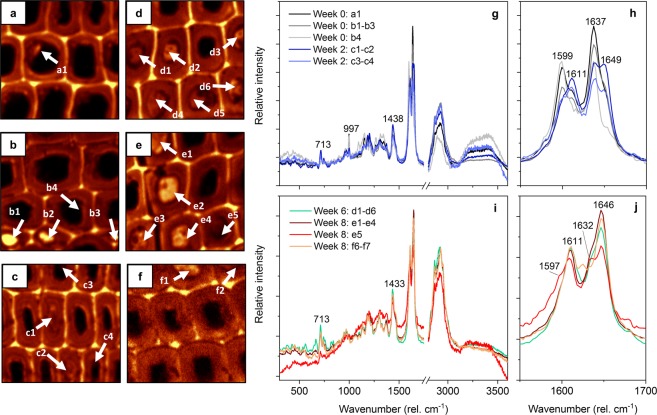
Figure 3.
Extractive deposits in heartwood degraded by R. placenta. Raman images of samples degraded for 0 (a,b), 2 (c), 6 (d) and 8 (e,f) weeks produced by integrating lignin and extractive bands at 1550–1700 cm−1, and the average Raman spectra of the week 0 and 2 (g,h) and the week 6 and 8 deposits (i,j). Deposits (arrows) are identified by their letter and number. All spectra have been baseline corrected and normalised by total intensity normalisation.

