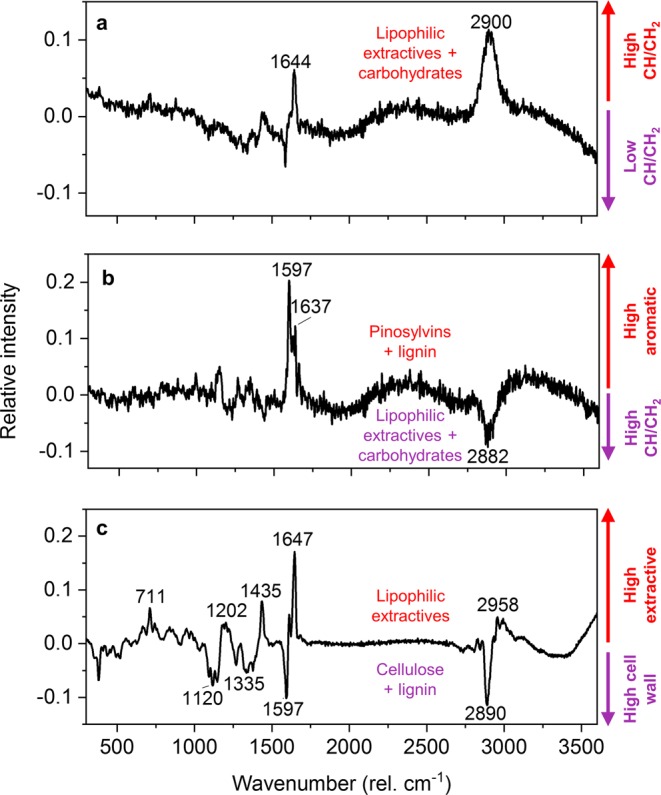
Figure 4.

PCA loading plots. PC 1 (a) separates data according to CH/CH2 stretching intensity (derived from carbohydrates and lipophilic extractives), while PC 2 (b) separates the data according to aromatic contributions (pinosylvins and lignin) and CH/CH2 stretching intensity (carbohydrates and lipophilic extractives). PC3 (c) separates the data according to contributions from lipophilic extractives and cell wall polymers (cellulose and lignin).
