Figure 5.
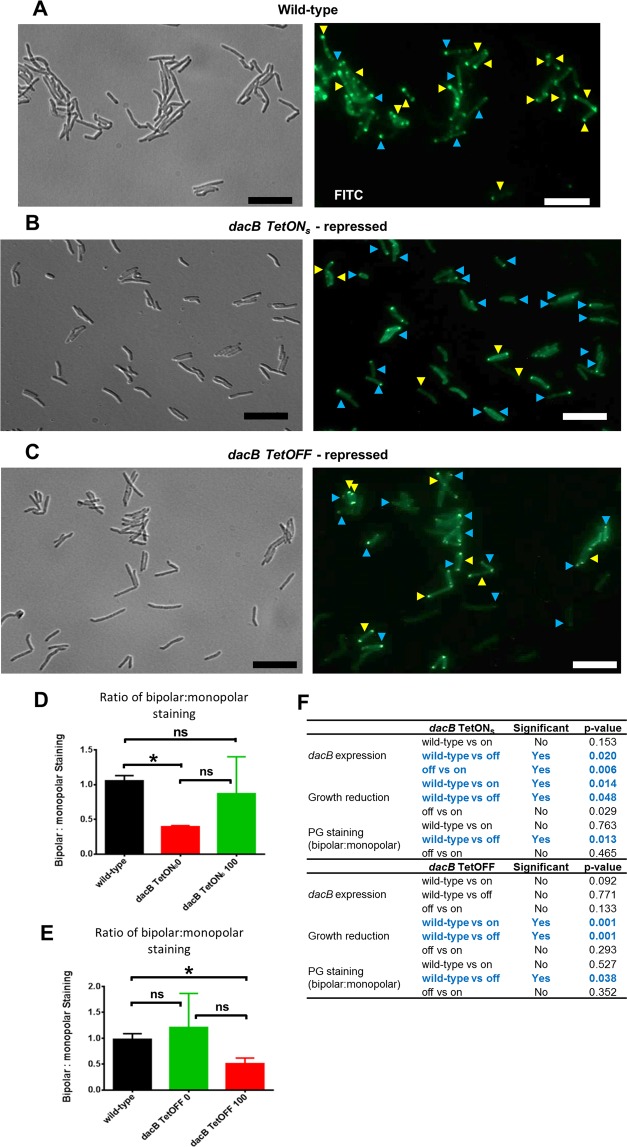
Repression of the dacB operon alters polar BODIPY-vancomycin staining. Strains were fluorescently labelled with BODIPY-vancomycin and scored for bipolar or monopolar staining. (A–C) Representative images for wild-type, dacB TetONs 0 ng/ml aTc (repressed) and dacB TetOFF 100 ng/ml aTc (repressed) respectively. Yellow and blue arrow heads indicate bipolar and monopolar PG staining patterns, respectively. Scale bar = 10 µm. For additional fields of view of each strain, refer to Supplementary Fig. S9. In both strains, where the dacB operon was repressed, the ratio of number of cells with bipolar:monopolar staining was determined and plotted as a function of the inducer and compared to wild-type. These data are shown for dacB TetONs in (D) and for dacB TetOFF in (E). In all cases, the wild-type strain served as a control and unpaired t-tests were used to detect statistically significant changes (*p < 0.05). (F) Table summarizing all statistical comparisons performed with associated p-values. Data are representative of three independent biological repeats in panels (A,C), with the exception of (B), which is representative of two.

