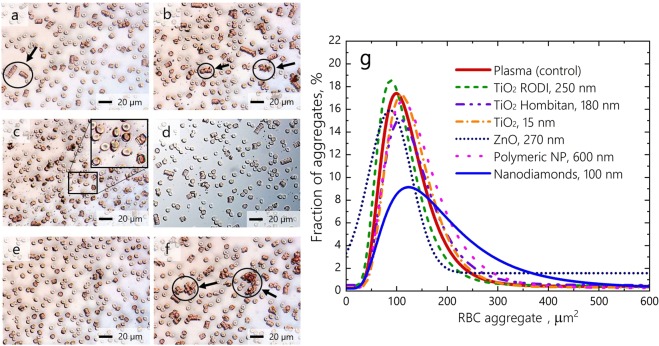
Figure 1.
Relative size distribution of RBC aggregates observed by conventional optical microscopy under normal conditions and influencing by polymeric NP 600 nm (a), TiO2 RODI 250 nm NP (b), TiO2 Hombitan AN 180 nm NP (c), TiO2 15 nm NP (d), ZnO 270 nm NP (e) and ND 100 nm (f). The RBC aggregates are encircled and indicated with arrows. (g) Distribution of RBC aggregates by occupied area based on the quantitative assessment of images in (a–f).

