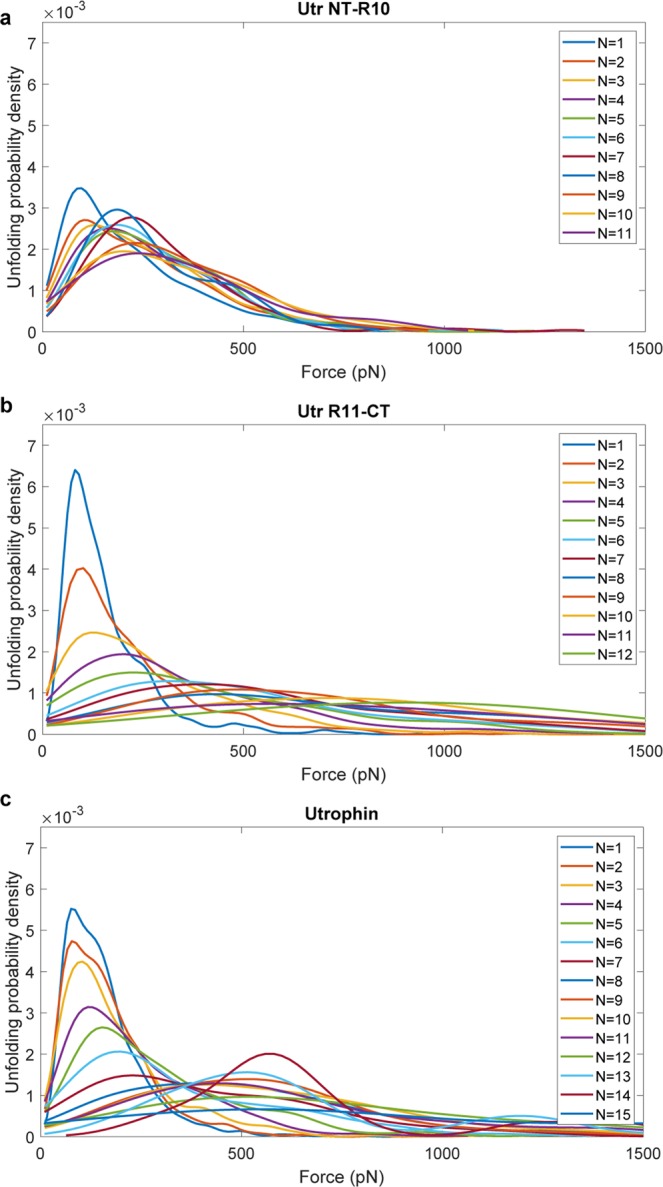
Figure 2.

Unfolding force distributions for utrophin terminal constructs reveal markedly different mechanical behaviors. (a–c) Plots of the probability distribution of unfolding force vs the unfolding force for Utr NT-R10 (a), Utr-R11-CT (b) and full-length utrophin (c) collected from 3 batches of 300–500 successful pulls per batch. Here, ‘N’ represents the unfolding event count. For example, the distribution corresponding to N = 4 represents the distribution of the 4th unfolding event.
