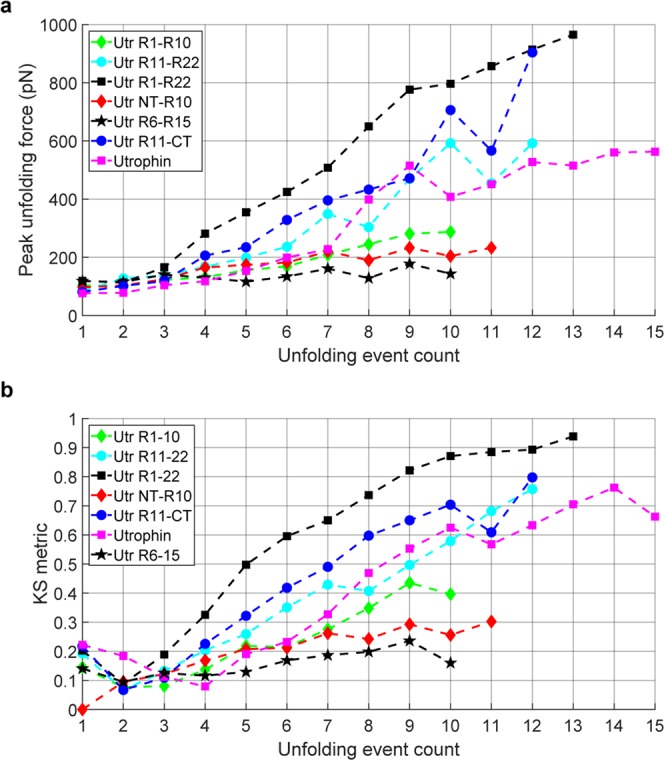
Figure 5.

Summary of utrophin mechanical behavior. (a) Comparison of modes of the unfolding force distributions vs unfolding event count shows brittle vs stiffening behavior of utrophin constructs. Peak (or mode) of the distribution of unfolding forces expressed as a function of the number of domains unfolded (unfolding event count). Data are combined over 3 batches of 300–500 successful pulling experiments per batch for each protein construct and more detailed statistics are provided in Supplemental Fig. S11. (b) KS metrics for the distributions of unfolding force corresponding to different unfolding event counts from each of the utrophin constructs. The KS metrics are computed by using the force distribution of the first unfolding event of Utr NT-R10 as the reference distribution.
