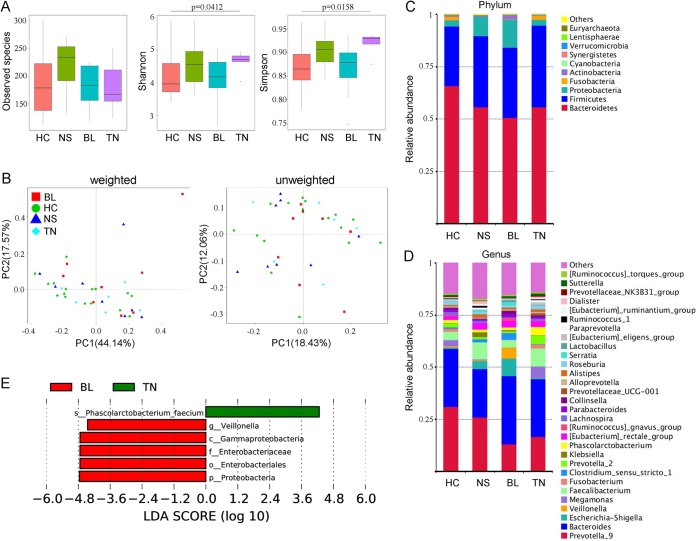
FIG 2.
Altered bacterial microbiota biodiversity and composition in AS patients receiving different therapeutic regimens. (A) Observed species and Shannon and Simpson indexes describing the alpha diversity of the bacterial microbiota in the different groups. (B) Beta diversity. Principal-coordinate analysis (PCoA) of Bray-Curtis distance with each group colored according to the different treatment methods. PC1 and PC2 represent the top two principal coordinates that captured most of the diversity. The fraction of diversity captured by the coordinate is given as a percentage. Groups were compared by a Permanova method. (C and D) Global composition of bacterial microbiota at the phylum and genus levels. (E) Taxa differentiating the AS-BL group from the AS-TN group.

