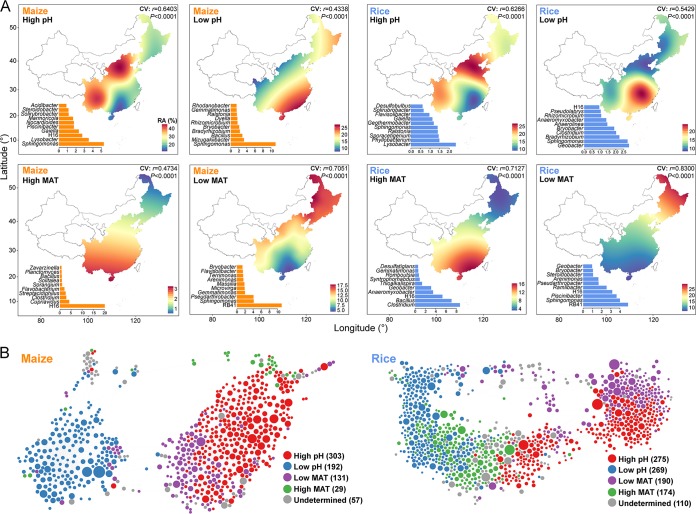
FIG 3.
Habitat preferences of the core microbiota in soil bacterial communities in maize and rice fields. (A) A continental atlas of the core bacterial taxa in soil bacterial communities in maize and rice fields. The map shows the predicted spatial distributions of the relative abundance (RA%) of the four major ecological clusters of the core bacterial taxa sharing habitat preferences for high pH, low pH, high MAT, and low MAT. Cross-validation (CV) of the map was based on Pearson correlation between the predicted and observed values at each sampling site. (B) Network diagram with nodes (core bacterial taxa) colored according to each of the four major ecological clusters identified in maize and rice fields. The size of each node is proportional to the relative abundance, and the thickness of each connection between two nodes (edges) is proportional to the value of Spearman’s correlation coefficients.

