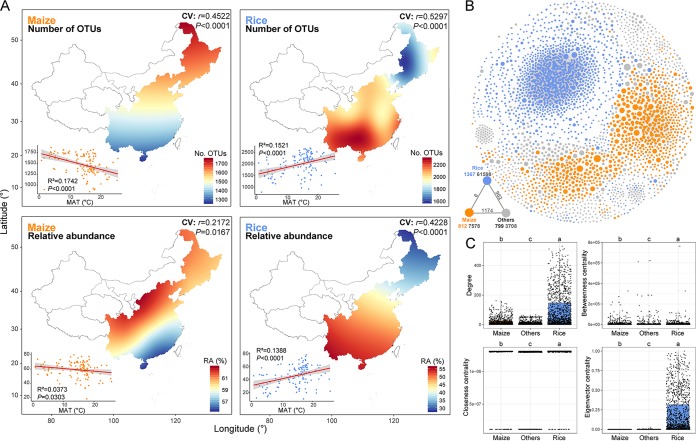
FIG 6.
Distinct spatial distributions and cooccurrence patterns of maize- and rice-enriched bacterial taxa. (A) Relationships of the number of OTUs and the relative abundance of enriched taxa versus MAT were estimated for each pairwise set of soil samples via linear least-squares regression analysis. Cross-validation (CV) of the map was based on Pearson correlation between the predicted and observed values at each sampling site. (B) Metacommunity cooccurrence networks of bacterial taxa in maize and rice soils based on a Spearman correlation analysis. A colored cooccurrence network is shown for maize- or rice-enriched taxa. A connection indicates a strong correlation (Spearman’s correlation coefficient of >0.6) and significance (false-discovery-rate-corrected P value of <0.01). The size of each node is proportional to the relative abundance of the OTUs; the thickness of a connection between two nodes (i.e., an edge) is proportional to the value of Spearman’s correlation coefficient. The external associations (black numbers) among each subcommunity are displayed. The numbers in black below each node represent the inner associations of each subcommunity, and the numbers of nodes in each subcommunity are colored according to the categories. (C) Unique node-level topological features of different categories of taxa, specifically the degree, betweenness, closeness, and eigenvector centrality. Box plots that do not share a letter are significantly different (P < 0.05; multiple comparison by Kruskal-Wallis test). Maize, maize-enriched OTUs; Rice, rice-enriched OTUs; Others, nonsignificantly different OTUs.

