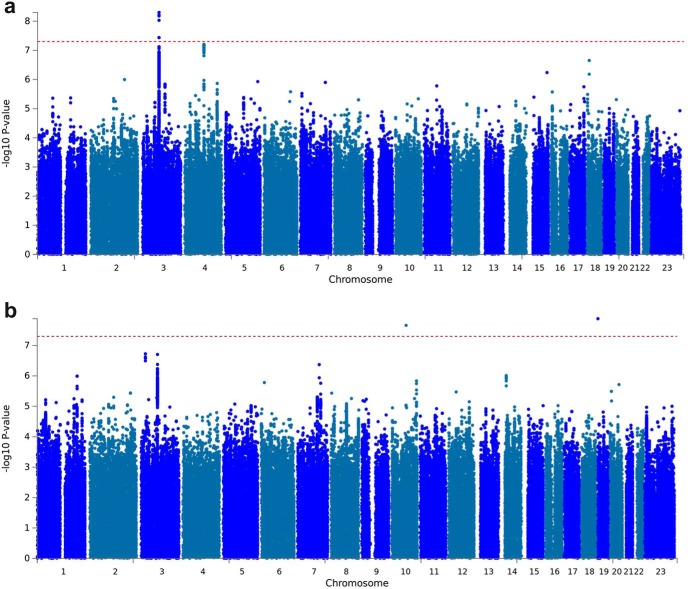
Figure 1.
Manhattan plot of GWAS results indicating the strongest associations between the 22 autosomes, X chromosome, and Sensation Seeking (a) and Drug Experimentation (b). Line denotes genome-wide significance (p < 5 × 10⁻⁸). The results have been adjusted for a genomic control inflation factor λ = 1.029 and λ = 1.031 (sample size = 22,745 and 22,572, respectively). For the Q-Q plots, see Figure 1-1, and Figure 1-9; for the regional association plots, see Figure 1-10, and Figure 1-18; and for the Manhattan plots of the MAGMA gene-based analyses, see Figure 1-19. See Figure 1-18 for the Manhattan and Q-Q plots and regional association plots for all UPPS-P and BIS subscales; and Figures 1-19 to 1-42 for additional analyses. See Figures 1-43 to 1-51, for the summary statistics for the top 10,000 SNPs.

