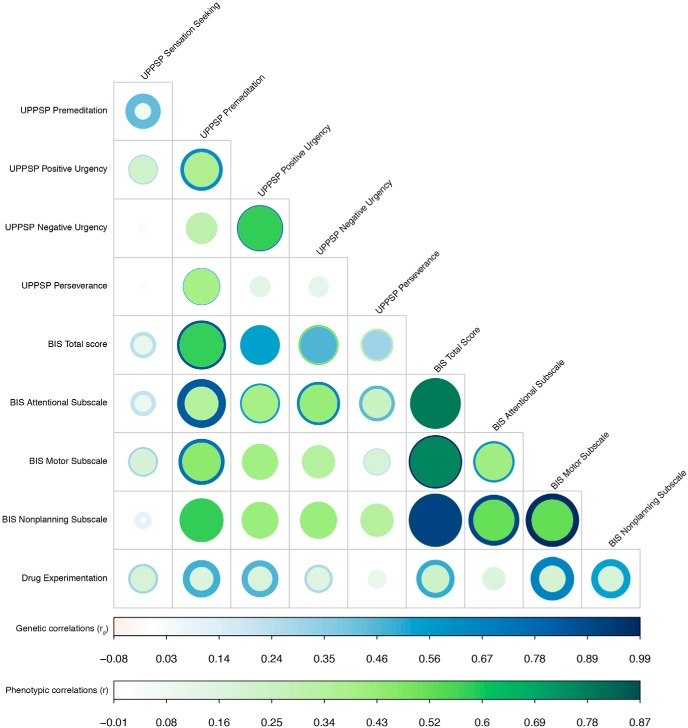
Figure 4.
Phenotypic (r; green) and genetic (rg; blue) correlations between UPPS-P and BIS subscales; corresponding correlation estimates and p values are shown in Figures 4-1 to 4-5. The width and color gradient of the circles indicate the strength of the correlation.

