


Figure 3.
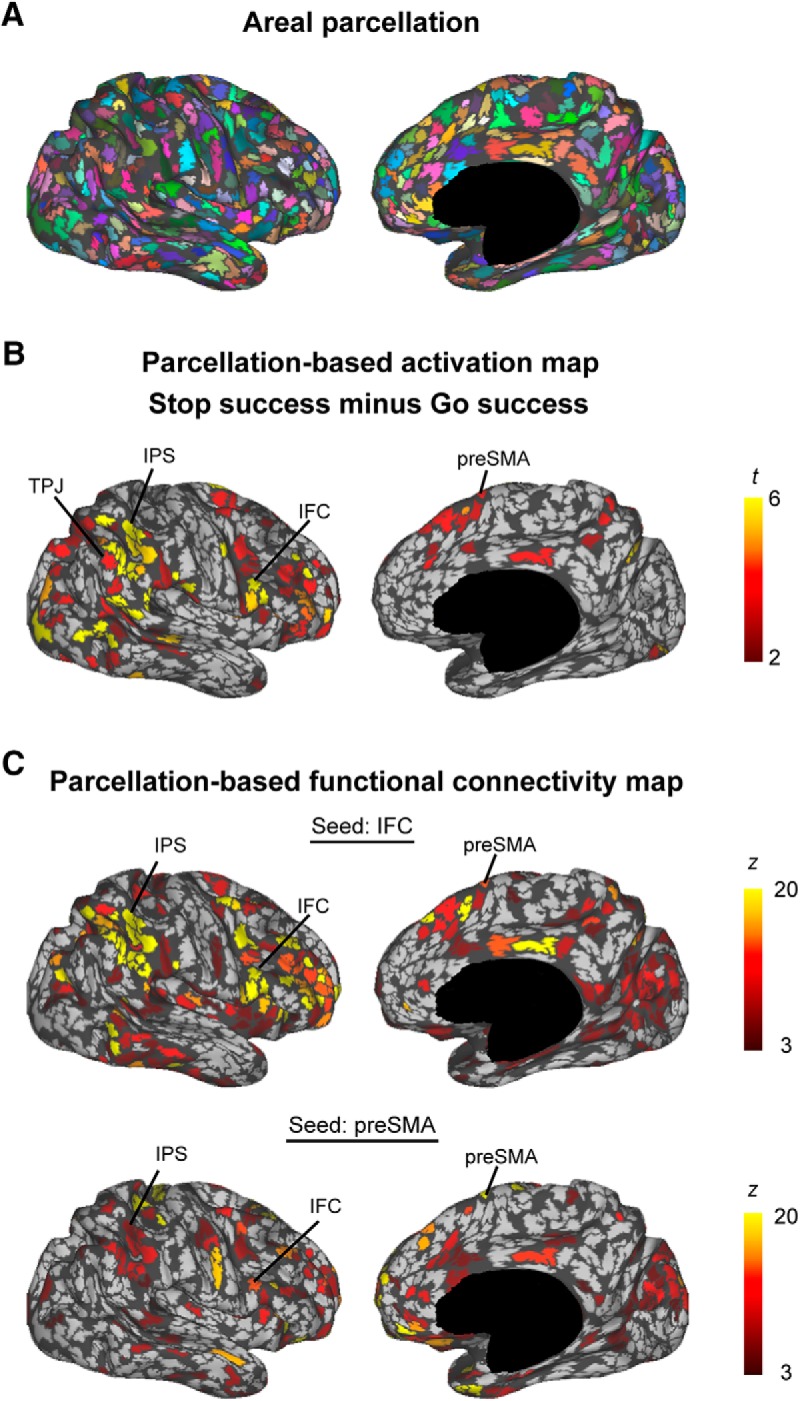
Brain activity and connectivity in parcellated areas. A, Parcellated areas in one representative subject shown in an inflated surface. Different colors indicate different parcellated areas. B, Brain activation during response inhibition. The statistical significance was calculated for each parcellated area. The color scale reflects statistical significance. C, Resting-state functional connectivity with the IFC (top) and the preSMA (bottom) for each parcellated area. The color scale indicates the Gaussian z score. See also Figure 3-1.