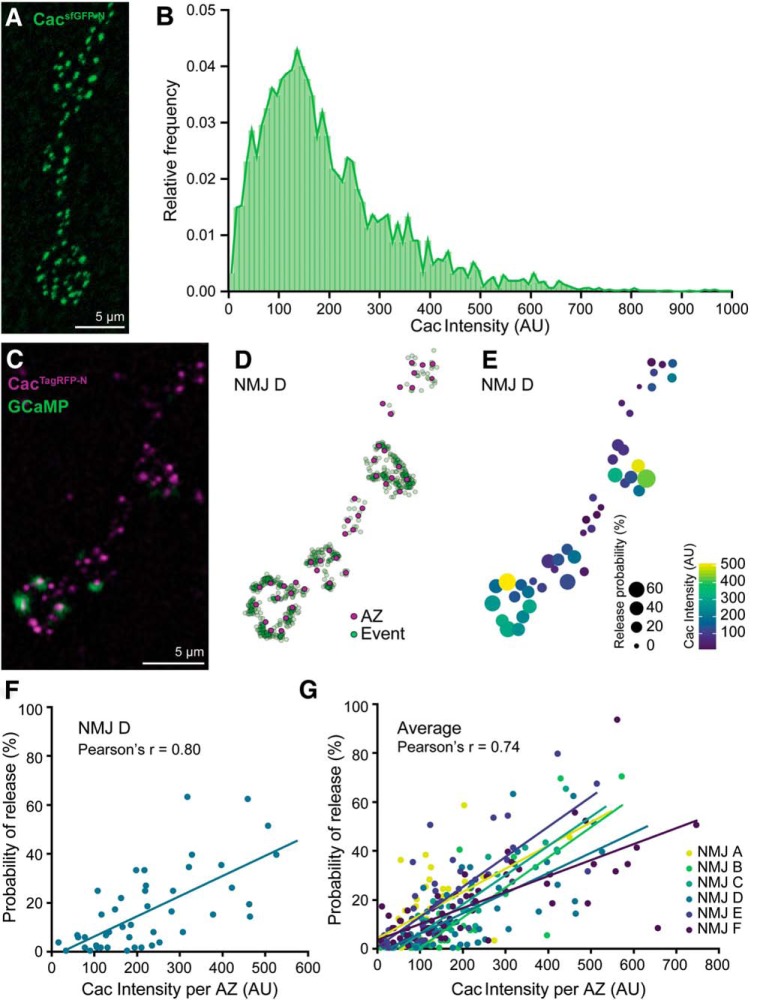
Figure 3.
CacsfGFP-N is heterogeneously distributed and highly correlated with Pr at individual AZs. A, Confocal Z-projection of a cacsfGFP-N NMJ labeled with an antibody against GFP. B, Broad distribution of Cac intensity across motorneuron AZs [n = 3067 AZs (10 data points are outside the x-axis limits shown) from 16 NMJs of 4 animals]. C, Confocal Z-projection of CacTagRFP-N superimposed on a single frame of a PS-GCaMP movie monitoring neurotransmission in a live cacTagRFP-N; PS-GCaMP preparation. D, Schematic of release events detected through postsynaptic GCaMP imaging (green dots) during 1 Hz stimulation mapped to individual AZs marked by CacTagRFP-N (magenta dots). E, Heat map indicating Pr and Cac intensity at each AZ by spot size and color, respectively. F, Correlation between Cac and Pr at a single NMJ (NMJ D, shown in C–E; r = 0.80, n = 44 AZs). G, Correlation between Cac and Pr at six NMJs in six larvae (average r = 0.74).

