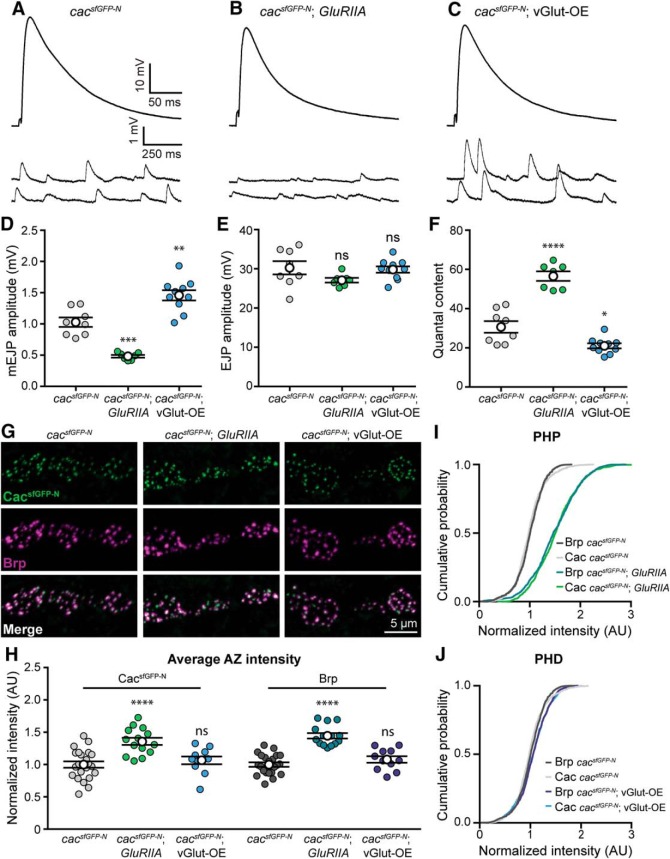
Figure 4.
Endogenous Cac is differentially regulated in chronic PHP and PHD. A–F, Chronic expression of PHP and PHD occurs normally in cacsfGFP-N animals lacking GluRIIA (GluRIIASP16) or overexpressing vGlut (vGlut-OE; OK371-Gal4>UAS-vGlut), respectively. A–C, Representative traces of EJPs and mEJPs recorded in 0.4 mm Ca2+ at cacsfGFP-N (A), cacsfGFP-N; GluRIIA NMJs (B), and cacsfGFP-N; vGlut-OE (C). D, mEJP amplitude is decreased in cacsfGFP-N; GluRIIA and increased in cacsfGFP-N; vGlut-OE as expected (cacsfGFP-N, 1.0 ± 0.08, n = 8 NMJs from 4 larvae; cacsfGFP-N; GluRIIA, 0.48 ± 0.02, n = 7 NMJs from 4 larvae, p = 0.0001, t test with Welch's correction; cacsfGFP-N; vGlut-OE, 1.5 ± 0.08, n = 10 NMJs from 4 larvae, p = 0.0017, Student's t test). E, EJP amplitude is unchanged between cacsfGFP-N, cacsfGFP-N; GluRIIA and cacsfGFP-N; vGlut-OE NMJs (cacsfGFP-N, 30.3 ± 1.70, n = 8 NMJs from 4 larvae; cacsfGFP-N; GluRIIA, 27.1 ± 0.60, n = 7 NMJs from 5 larvae, p = 0.1115, t test with Welch's correction; cacsfGFP-N; vGlut-OE, 29.8 ± 0.81, n = 10 NMJs from 4 larvae, p = 0.80, Student's t test), as expected. F, Quantal content is increased in cacsfGFP-N; GluRIIA and decreased in cacsfGFP-N; vGlut-OE as expected (cacsfGFP-N, 30.7 ± 3.0, n = 8 NMJs from 4 larvae; cacsfGFP-N; GluRIIA, 56.6 ± 2.4, n = 7 NMJs from 4 larvae, p < 0.0001, Student's t test; cacsfGFP-N; vGlut-OE, 21.0 ± 1.3, n = 10 NMJs from 4 larvae, p = 0.0145, t test with Welch's correction). G, Confocal Z-projections of Cac and Brp in cacsfGFP-N, in cacsfGFP-N; GluRIIA and in cacsfGFP-N; vGlut-OE motorneuron boutons colabeled with antibodies against GFP and Brp. H, Normalized intensity of Cac and Brp puncta averaged for each NMJ in control, GluRIIA and vGlut-OE animals (Cac levels: cacsfGFP-N, 1.00 ± 0.05, n = 22 NMJs from 9 larvae; cacsfGFP-N; GluRIIA, 1.36 ± 0.06, n = 14 NMJs from 5 larvae, p < 0.0001, Student's t test; and cacsfGFP-N; vGlut-OE, 1.07 ± 0.06, n = 11 NMJs from 5 larvae, p = 0.43, Student's t test. Brp levels: cacsfGFP-N, 1.00 ± 0.05, n = 22 NMJs from 4 larvae; cacsfGFP-N; GluRIIA, 1.44 ± 0.04, n = 14 NMJs from 5 larvae, p < 0.0001, Student's t test; cacsfGFP-N; vGlut-OE, 1.08 ± 0.06, n = 11 NMJs from 5 larvae, p = 0.19, Student's t test). I, Cumulative probability distributions of Cac and Brp puncta intensities demonstrate an increase in both Brp and Cac levels across AZs of GluRIIA animals [Cac levels: cacsfGFP-N, n = 1475 AZs; cacsfGFP-N; GluRIIA, n = 1475; (3 data points are outside the x-axis limits shown); Brp levels: cacsfGFP-N, n = 1475 AZs; cacsfGFP-N; GluRIIA, n = 1475 AZs]. J, Cumulative probability distributions of Cac and Brp puncta intensities show no decrease in Brp or Cac levels across AZs of vGlut-OE animals [Cac levels: cacsfGFP-N, n = 1475 AZs; cacsfGFP-N; vGlut-OE, n = 1443 (7 data points are outside the x-axis limits shown); Brp levels: cacsfGFP-N, n = 1475 AZs; cacsfGFP-N; vGlut-OE, n = 1443 AZs]. Not significant (ns), *p < 0.05, **p < 0.01, ***p < 0.001, and ****p < 0.0001.

