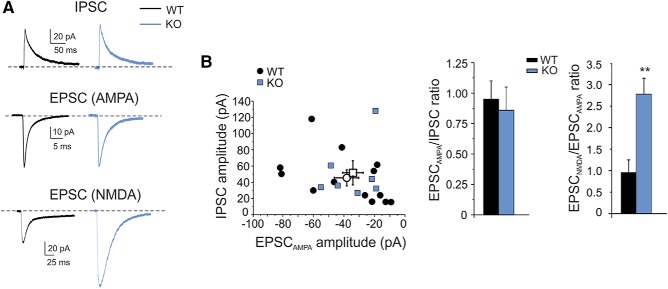
Figure 2.
Evoked excitatory and inhibitory currents in granule cells. A, Synaptic currents in WT and IB2 KO granule cells. The EPSCAMPA and IPSC values are recorded from the same cells at the holding potential of −70 mV (average of 30 consecutive traces) and at +10 mV (average of 10 consecutive traces), respectively. The EPSCNMDA values are recorded in different cells at −70 mV in Mg2+-free extracellular solution in the presence of the AMPA receptor antagonist 10 μm NBQX (average of 30 consecutive traces). B, IPSC/EPSC ratios at mossy fiber–granule cell synapses in WT and IB2 KO mice. The plot shows the amplitude of EPSCAMPA and IPSC in the same cells for WT and IB2 KO mice (open symbols, mean ± SEM). The histogram compares the average EPSCAMPA/IPSC ratio and EPSCNMDA/IPSC ratio in WT and IB2 KO mice. Data are reported as the mean ± SEM. **p < 0.01.

