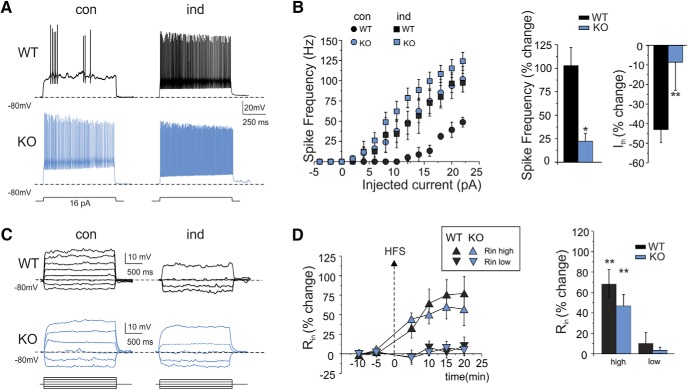
Figure 6.
Long-term enhancement in granule cells intrinsic excitability. A, Voltage responses to current injection in WT and IB2 KO granule cells recorded in control and 20 min after HFS. Note that HFS enhances spike generation both in WT and IB2 KO granule cells. B, Spike frequency is plotted as a function of current injection in control conditions and after HFS both in WT and in IB2 KO mice. Note that, after HFS, spike frequency increases more in WT than in IB2 KO mice. The histograms compare the average spike frequency and threshold current (Ith) changes in WT and IB2 KO mice. Data are reported as the mean ± SEM. *p < 0.05, **p < 0.01. C, Subthreshold voltage responses to current injection in WT and IB2 KO granule cells recorded in controls and 20 min after HFS. Note that the voltage response in the high-potential region is enhanced both in WT and IB2 KO granule cells. D, The plot shows the average time course of Rin changes after HFS stimulation in two subthreshold membrane potential regions, less than −70 mV (Rin-low) and more than −70 mV (Rin-high). After HFS, in both WT and IB2 KO granule cells, Rin-high, but not Rin-low, increased. The histogram shows the average Rin changes for WT and IB2 KO mice. Data are reported as the mean ± SEM. **p < 0.01.

