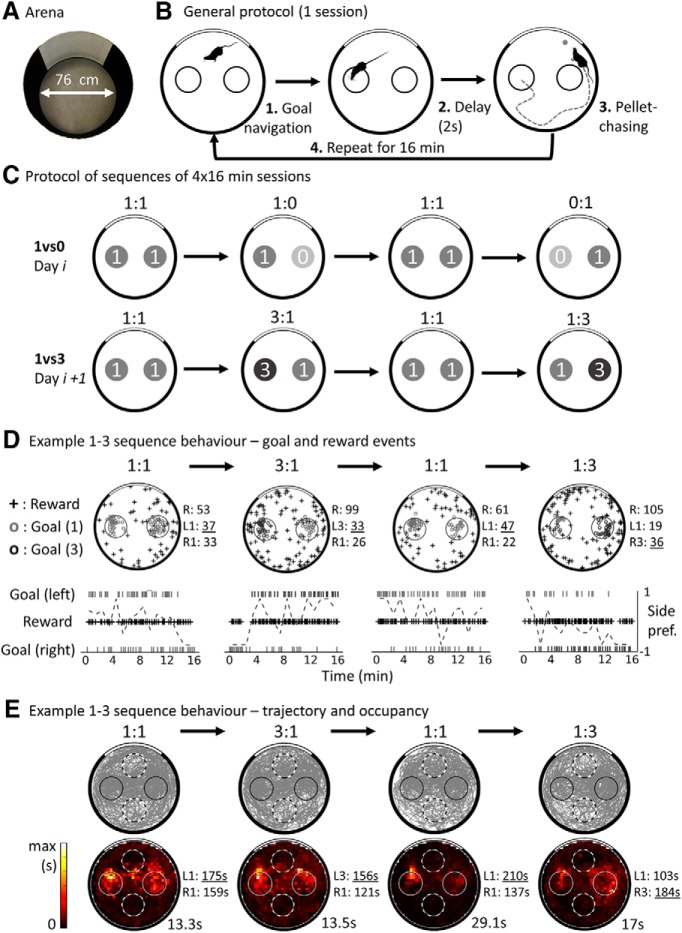
Figure 1.
Protocol and behavior in the two-goal navigation task. A, View of the task arena from above. B, Task protocol. First, the rat navigates to one of the two goal zones, represented as small circles and corresponding to 20-cm-diameter unmarked zones located to the left or right of a white cue card. If the rat waits for 2 s in a goal, then a food pellet is released from an overhead dispenser and stops at a random location. Then, the rat leaves the goal to find and consume the food. The process repeats during 16 min sessions. C, Example of two possible sequences of sessions; a specific sequence was performed on a given day, with no indication of change between its sessions. A control session was always performed first (equal rewards, 1:1), followed by a session with different values (e.g., 1:0, right goal unrewarded), then another control session (1:1), and finally the mirrored version of the first value session (e.g., 0:1, left goal unrewarded). On the next day, a sequence with the other set of goal values was usually performed (in 1:3 or 3:1, the right or left goal provides 3 simultaneous pellets). D, Top, location of events from an example 1vs3 sequence. Reward consumption events are shown as crosses; correct (duration ≥ 2 s) goal visit events are shown as small circles. The number of recorded events of each type is shown at the right of each plot; the highest number of goal visits is underlined for each session. Note that reward locations appear randomly distributed in the environment and that goal events are concentrated on the goal zones (with rare occurrences of mistracked events). Bottom, Timing of events from the same 1:3 sequence: raster marks at the top and bottom show left and right goal activation events, respectively. Cross marks show reward consumption events. The dotted line shows the side preference index of the rat toward the left or right (see Materials and Methods) computed in 1 min time bins. Note that the preference is approximately balanced in the first session, but switches toward the high-value goal on the 3:1 and 1:3 sessions, indicating sensitivity of the rat to the changing reward values. E, Rat trajectory (top) and occupancy map (bottom) for the example sessions shown in D. The gray lines show the path of the rat; goals are shown as solid circles and control nongoal zones as dotted circles. The peak time for each occupancy map is shown in seconds.

