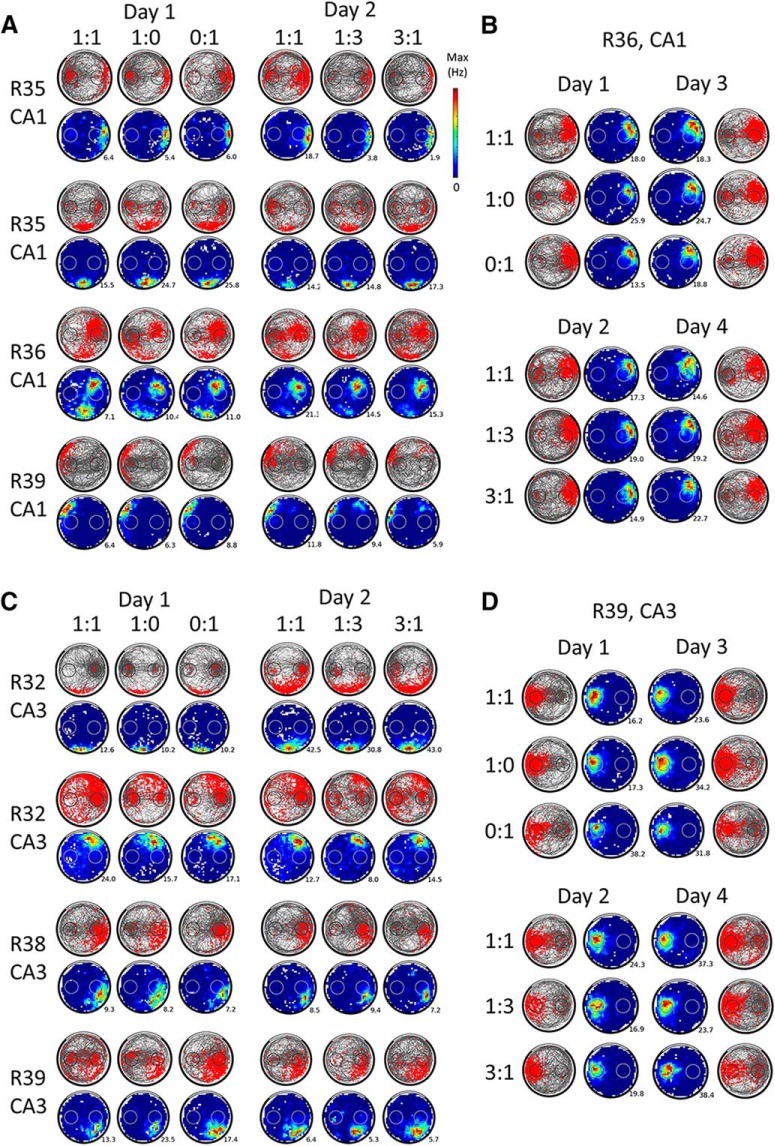
Figure 4.
Place cells' activity remains spatially stable when goal value changes. A, Activity of 4 example place cells from CA1 that were recorded for at least 2 d in the 1vs0 sequence and the 1vs3 sequence. The third session of each daily sequence (1:1) is not shown because it was not included in the analyses. Note that the order of the different sessions (or days) shown does not necessarily reflect the actual temporal order of the experiment (the position of the value-changing goal was counterbalanced between successive sessions of the same type as was the type of sequence). For a given cell, the spike plots (red spikes on gray trajectory) of each 16 min session are shown on the first row and the corresponding rate maps (average firing rate per bin, smoothed, with maximum firing rate indicated) are shown on the second row. Note how the rat behavior (visible on the spike plots) usually reflects goal values but how spatially stable the firing of the place cells remains within or across days regardless of changes in goal value. This is the case even for place fields located on a goal (e.g., third cell from the top). Also note the often increased spiking at the goal zones (outside of place fields), which contributes to the population goal-related signal. B, Example of a CA1 place cell recorded during 4 different days, allowing for sampling of each value condition twice per goal. Spike and rate maps are shown as in A. Note the stability of the spatial firing across different value conditions. C, Activity of 4 example place cells recorded during at least 2 d from CA3, presented as in A. D, Example of a CA3 place cell recorded for 4 different days, presented as in B. For CA3 cells, changes in goal value also do not appear to affect the firing of place cells.

