Figure 5.
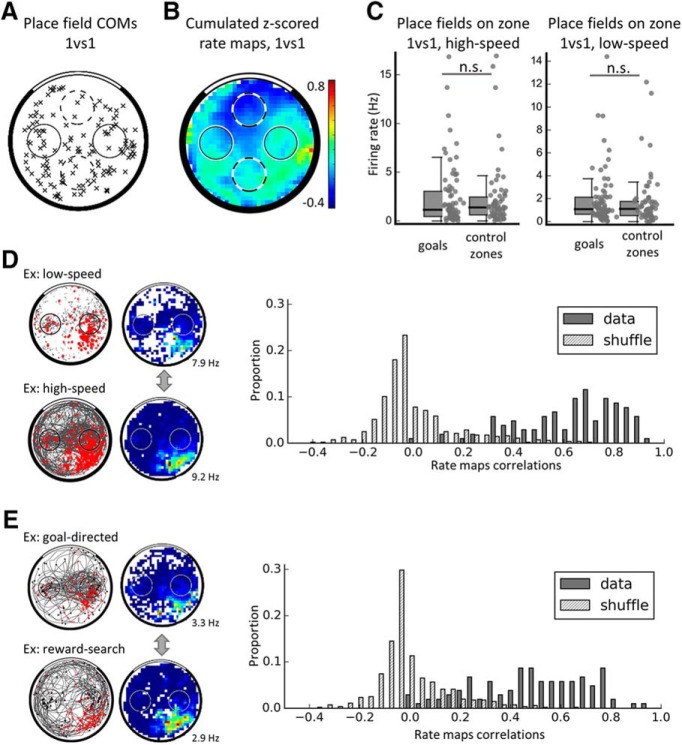
Place fields do not overrepresent the goal locations in the equal value (1vs1) condition. A, Distribution of the COMs of all place fields in the 1vs1 condition. Place fields did not significantly overrepresent goal locations (black circles) compared with control zones (dashed circles). B, For illustration purposes, cumulative firing map in the 1vs1 condition (average Z-score in each location) using the Z-scored speed-filtered map of each place cell. Note that firing rate does not seem to increase specifically at the goals. Average Z-score is indicated. C, Firing rate of place fields compared between goals and control nongoal zones either for high speeds (>15 cm/s, left) or low speeds (<15 cm/s, right). Individual data points are shown as well as boxplots (which are as in Fig. 2B). Place fields do not increase (nor decrease) their firing at the goals compared with the nongoals. D, Correlations of all (smoothed) place cell maps at low versus high speed compared with a shuffle distribution. The data are more correlated than chance and centered on high correlation values; therefore, there is no global remapping between low speeds and high speeds. An example cell from CA3 is shown on the left. E, Similar correlations as D but between goal-directed versus reward-search maps, with reward events shown as stars and goal events shown as triangles. The example is from the same cell as in D. Again, the distribution of correlations from our dataset are significantly higher than chance; therefore, there is no global remapping of place cells between these two task phases.

