Figure 8.
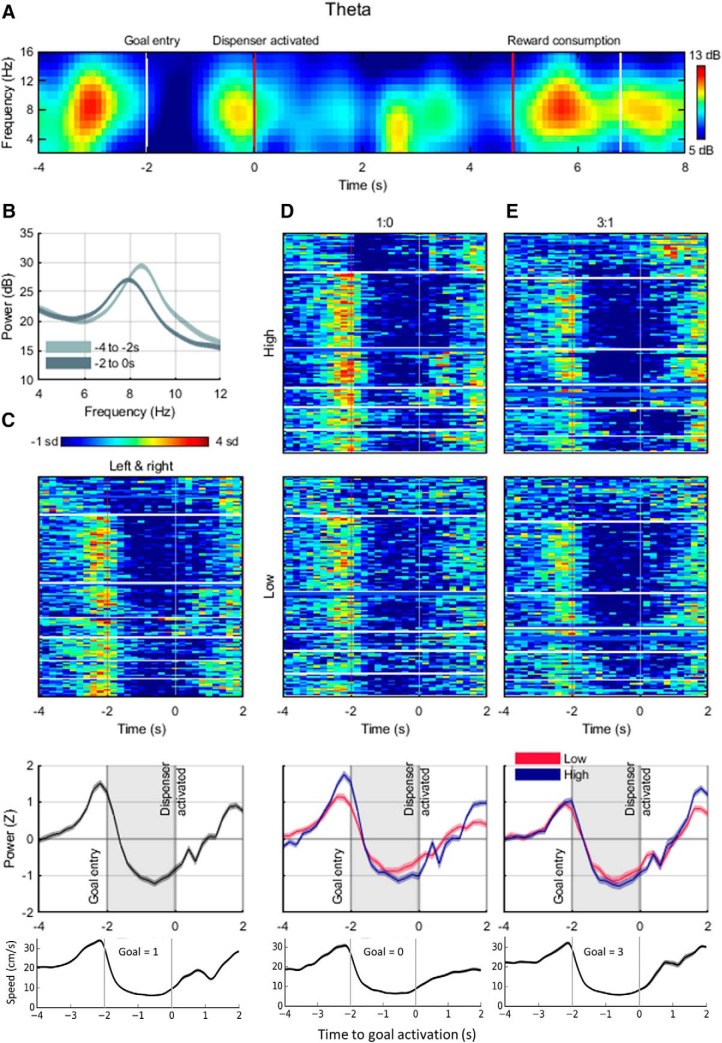
Theta power and frequency at the goal. A, Individual example of power spectral density estimate in the theta band for 12 s of task behavior. Note the decrease in theta power during the goal period and the increase following reward consumption. B, Average frequency over all 1vs1 sessions in the theta band before (−4:−2) and during (−2:0) the goal period. Note the decrease in frequency when waiting at the goal, as well as the decrease in power. C, Top, Average Z-scored power in the theta band for each 1vs1 session around the goal period (left and right goals were combined because none of the parameters of interest was different between them). White horizontal lines indicate boundaries between different rats. Middle, Averaged Z-scored power in the theta band over all 1vs1 sessions. Note the decrease in theta power upon entry in the goal zone. Bottom, Averaged speed at the goal for these sessions accumulating left and right trials. Note the striking similarities between theta power and speed. D, Z-scored theta power for each of 1vs0 sessions either for the high-value goal (1 pellet, top) or the low-value goal (0 pellet, middle). The bottom part shows the averaged Z-scored theta power, together with the average speed for the low-value goal. Note how theta power appears different between the two value conditions. E, Z-scored theta power at the goal as for D but in 1vs3 sessions for the high-value goal (3 pellets, top) or the low-value goal (1 pellet, middle). Averaged Z-scored power and speed for the high-value goal are shown below. Note the similarity of theta power between the two value conditions.

