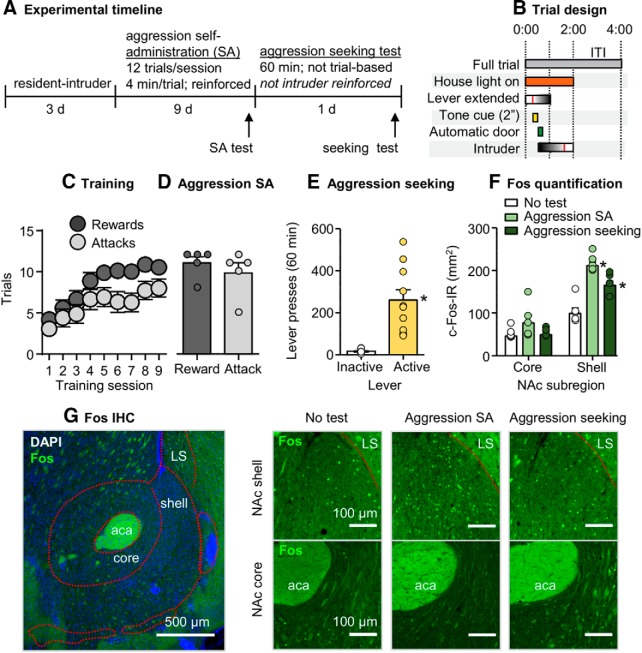
Figure 1.
Aggression self-administration and aggression seeking caused higher Fos expression in NAc shell than core. A, Timeline of Experiment 1. B, A schematic of a single self-administration trial. Vertical red lines within the “lever extended” and “intruder” bars indicate an active lever press and removal of an intruder after an attack bout, respectively, relative to total possible durations. C, Number of rewarded and attack trials over 9 d (48 min session/d) of aggression self-administration under an FR1 reinforcement schedule in CD-1 mice (n = 15). Data are combined from all experimental groups (self-administration test, aggression seeking test, and control). D, Number of reward and attack responses on the final day of training for the subset of mice that were included in the self-administration group during the self-administration test session (n = 5). E, Number of active and inactive lever presses during a 60 min non-reinforced aggression seeking test (n = 10). F, Fos-labeled cells (counts/mm2) in the NAc core and shell subregions across experimental groups (self-administration test, aggression seeking test, and control). G, Representative images of the NAc shell and core stained for Fos with DAPI (left). Representative images of Fos in the NAc shell or core across experimental groups (right). Data are mean ± SEM. *Different from the control group, p < 0.01. aca, Anterior commissure; LS, lateral septum.

