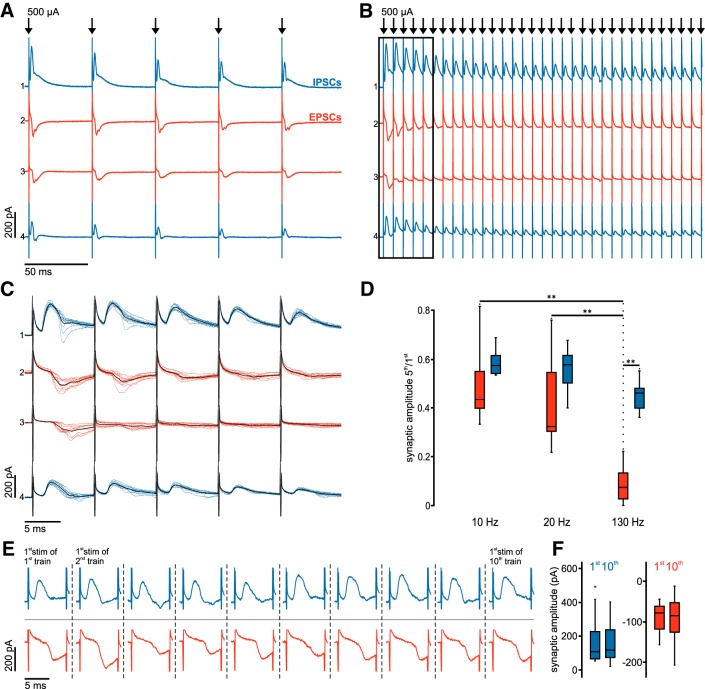
Figure 6.
Sustained inhibition during DBS-like stimulation contrasts rapid depression of excitatory inputs. A, Averaged voltage-clamp traces at 20 Hz stimulation frequency in four simultaneously recorded STN neurons. B, Averaged voltage-clamp traces from the same STN neurons as in A at 130 Hz stimulation frequency. C, Same traces as in B (black frame), albeit as single sweeps at higher temporal resolution; the respective average traces are superimposed in black. D, Group data (n = 12 compound, predominantly glutamatergic EPSCs: red boxes; and n = 9 compound, predominantly GABAergic IPSCs: blue boxes) show distribution of synaptic depression ratios (fifth/first) for the respective stimulation frequencies. **Highly significant difference (p < 0.01). E, Representative traces show the synaptic responses evoked by the first pulses of the 10 consecutive 130 Hz stimulus trains. Blue represents compound, predominantly GABAergic IPSCs. Red represents predominantly glutamatergic EPSCs. F, Summary box charts show the peak amplitudes of the first synaptic responses in the first and 10th stimulation trains. Blue represents compound, predominantly GABAergic IPSCs (n = 9). Red represents compound, predominantly glutamatergic EPSCs (n = 12).

