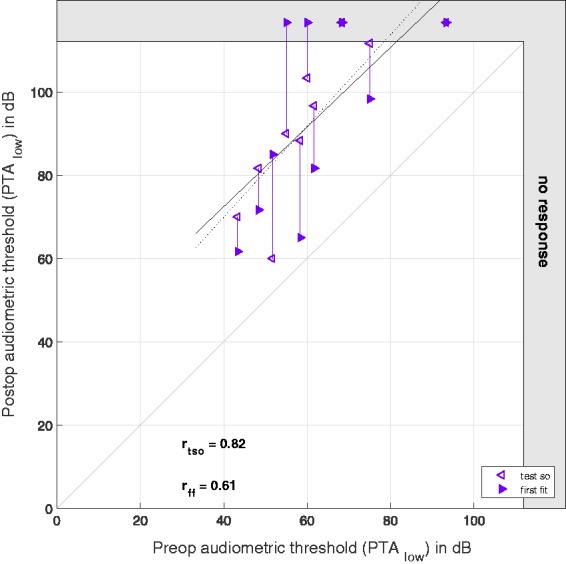
Figure 3.

Pure tone audiometry as PTAlow before and after surgery. On the x axis, the preoperative hearing thresholds are plotted, and on the y axis, the postoperative hearing thresholds as measured at the (TSO) (hollow markers) and the first fitting week (full markers). The data points representing the same subjects are connected by vertical lines. The gray area at the right and upper edge represents the area above the possible stimulation levels. The dashed regression line refers to the (TSO) data and the full line to the first fitting data. The correlation coefficients are given for the preoperative thresholds compared with the postoperative thresholds at the (TSO) and the first fitting, respectively. The gray bisecting line indicates the ideal relationship between pre- and postoperative data.
