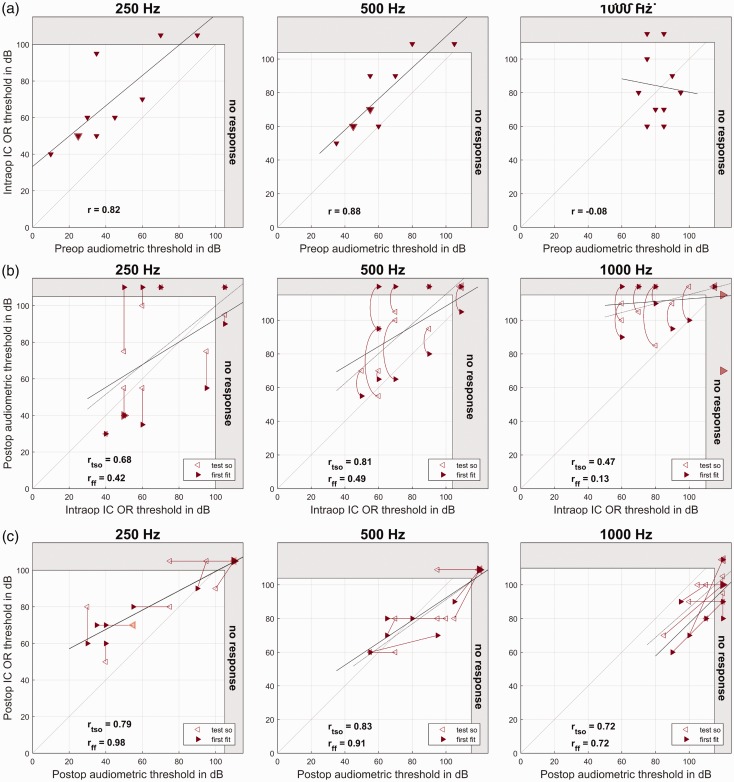
Figure 5.
Intracochlearly (IC) recorded OR thresholds. (a) Intraoperative IC OR recordings compared with pure tone audiometry before surgery. On the x axis, the IC OR thresholds are plotted, and on the y axis, the preoperative hearing thresholds. (b) Intraoperative IC OR recordings after insertion compared with pure tone audiometry after surgery. On the x axis, the postinsertion OR thresholds are plotted, and on the y axis, the postoperative hearing thresholds as measured at the TSO (hollow markers) and the first fitting week (full markers). (c) Postoperative IC OR recordings versus pure tone audiometry during the follow up. On the x axis, the IC OR thresholds are plotted, and on the y axis, the hearing thresholds. Both are measured at the TSO (hollow markers) and the first fitting week (full markers). Larger markers represent multiple data points. The data points representing the same subjects are connected by straight or curved lines. The dotted regression line refers to the TSO data and the full line to the first fitting data. The gray area at the right and upper edge represents the area above the possible stimulation levels. From the left to the right panels, the different frequencies are shown.
IC = intracochlear; OR = ongoing response.

