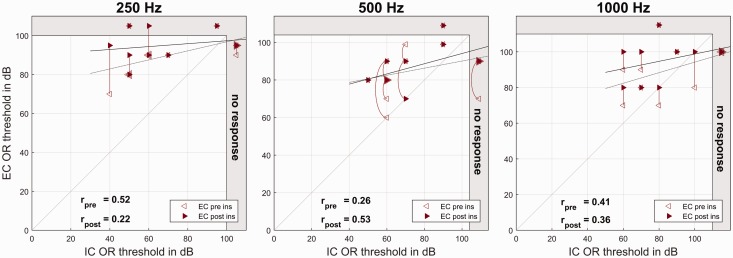
Figure 6.
Intraoperative ECochG recordings. On the x axis, the (postinsertion) IC ECochG thresholds are plotted, and on the y axis, the EC ECochG thresholds before (hollow markers) and after CI insertion (full markers). Larger markers represent multiple data points. The data points representing the same subjects are connected by vertical or curved lines. The dotted regression line refers to the preinsertion data and the full line to the postinsertion data. The gray area at the right and upper edge represents the area above the possible stimulation levels. From the left to the right panels, the different frequencies are shown.
IC = intracochlear; OR = ongoing response; EC = extracochlear.

