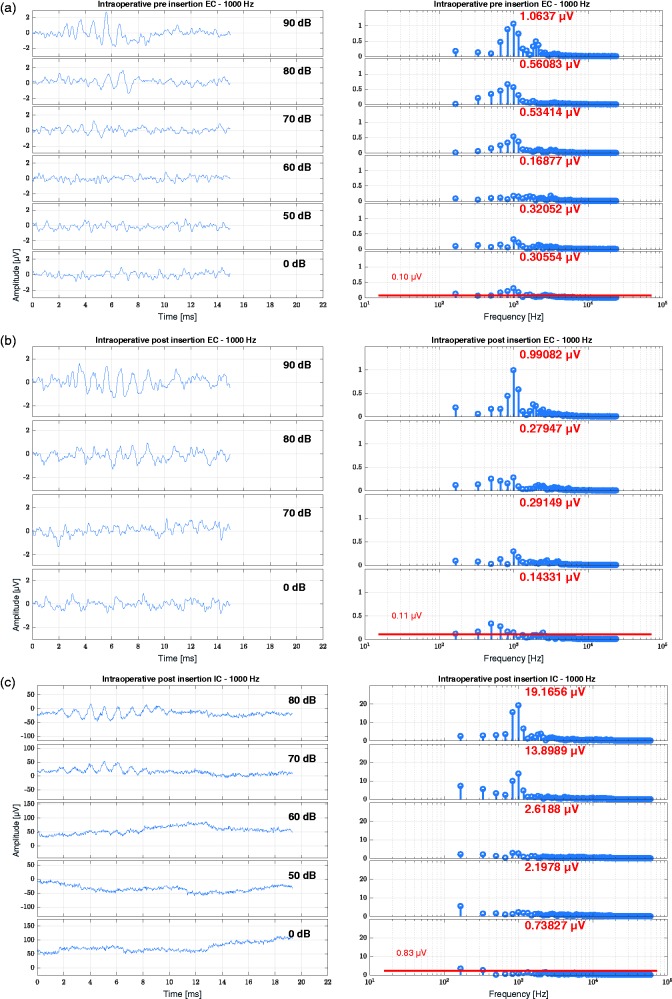
Figure 7.
Results of an intraoperative OR recording (Subject S07, age 45.7 years, 24-mm inserted electrode depth on the right side). (a) EC recording before insertion, (b) EC recording after insertion, and (c) IC recording after insertion. Here the data are shown for a 1 kHz tone burst. The pure tone threshold at 1 kHz was before surgery at 75 dB HL, at the TSO at 110 dB HL and at the first fitting at 90 dB HL. From top to bottom, the stimulation level is decreasing. On the left panels, the time signal is shown, and on the right panels, the frequency analysis by FFT. The red number at each FFT plot states the amplitude at the frequency bin of the stimulus level. In the lowest FFT plot of each panel representing the recording at 0 dB, the noise floor estimation is plotted and numeralized.
IC = intracochlear; EC = extracochlear.

