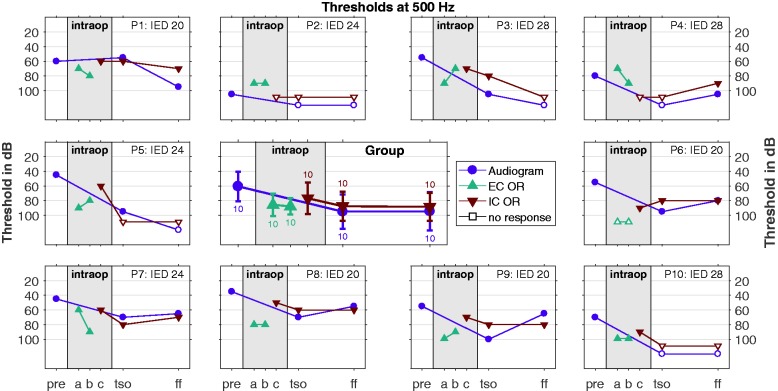
Figure 8.
Course of the thresholds (OR and audiogram) over time up to the first fitting appointment. Here the data are shown for the 500 Hz stimulation, the data for 250 Hz and 1 kHz can be found in the Supplementary Files which are available online at the homepage of the journal. In the middle panel, the group data for all subjects are shown (mean and standard deviation as well as number of cases), and in the outer panels the individual data for all subjects. The stimulus response thresholds as well as the audiometric thresholds are represented by filled markers, whereas cases with no responses are represented by hollow markers 10 dB above the stimulation limit. On the x axis, the time course is plotted with the following appointments: “pre”—before surgery, “a”— EC recording before insertion, “b”—EC recording after insertion, “c”—IC recording after insertion, “TSO”—test switch-on, typically 2 days after surgery, and “FF”—first fitting, 5 weeks after surgery.
IC = intracochlear; OR = ongoing response; EC = extracochlear.

