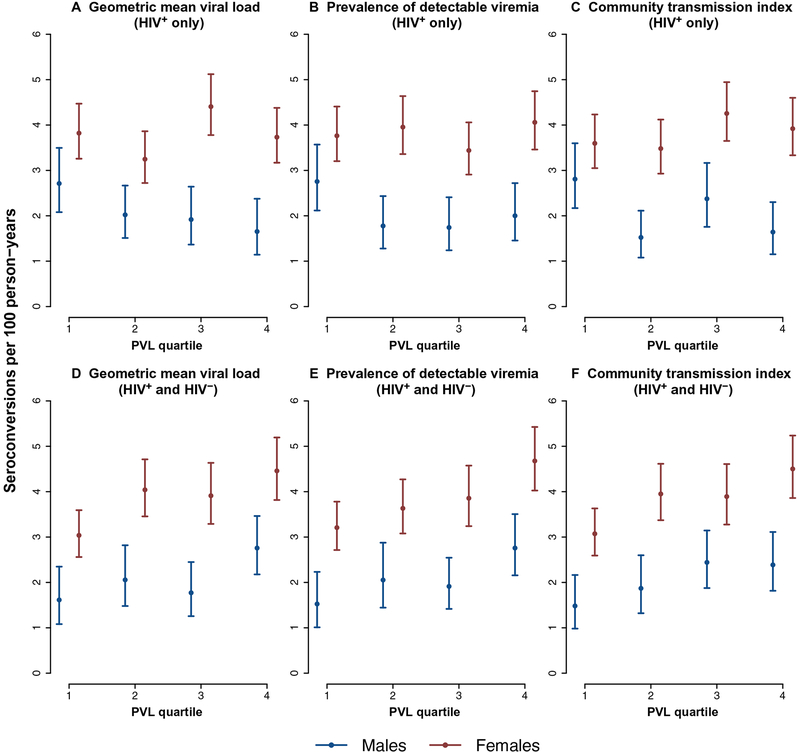
Fig. 3. Graphs showing the ecological relationship between HIV incidence (2011 to 2015) and PVL quartiles derived from the 2011 population-based viral load survey (quartile 1, communities with lowest PVL values).
The PVL indices are derived from HIV-positive participants only (A to C) and HIV-positive and HIV-negative participants (D to F). Incidence estimates are shown with 95% confidence intervals.

