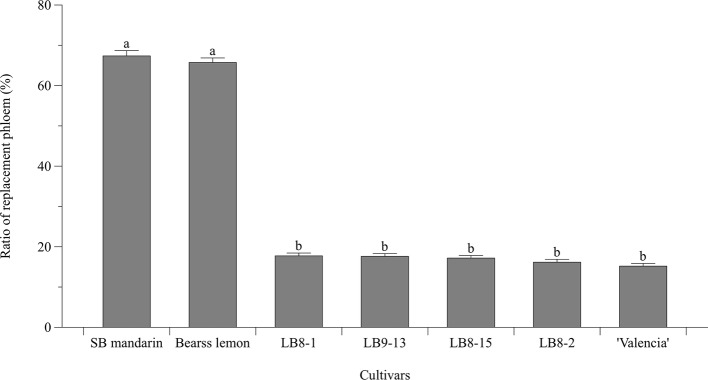
Figure 6.
Bar chart showing the ratio (%) of replacement phloem (the replacement phloem width/the total phloem width × 100). Bar and error bar denote means and 95% confidence intervals, respectively. Means that are significantly different in one way ANOVA analysis and Tukey’s HSD test are represented by different small letters above bars (p < 0.05).

