
FIG. 5.
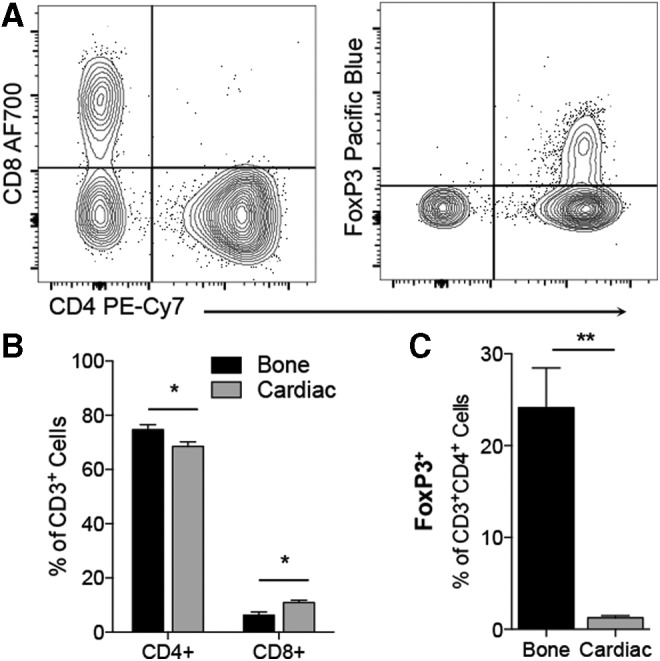
T cell profile is dominated by CD4+ T cells. (A) Representative plots of CD4 versus CD8 profile and FoxP3 gating. (B) CD4/CD8 ratio in bone- and cardiac-derived scaffolds. (C) FoxP3+ Tregs are detected at higher levels in bone ECM than cardiac ECM. Data are mean ± SEM, n = 4. Significance determined by Student's t-test.