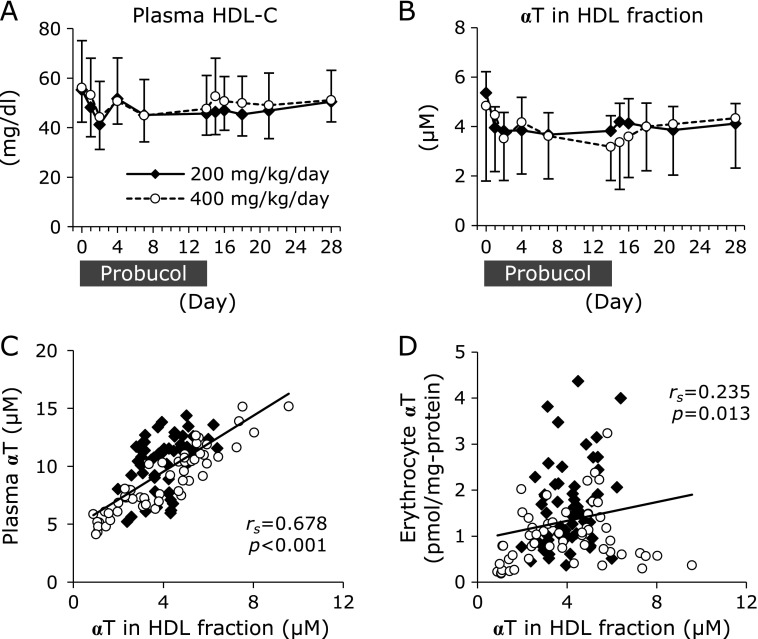
Fig. 3.
Probucol effect on plasma high-density lipoprotein concentration and α-tocopherol (αT) contents. The plasma concentrations of HDL-C (A) and αT in HDL fractions (B) were measured. The data are expressed as mean ± SD. Statistical analysis was carried out using ANOVA. (C) The correlation between the concentration of αT in HDL fractions and plasma αT concentration. (D) The correlation between the concentration of αT in HDL fractions and αT concentration in erythrocytes. The normality of data distribution was assessed using the Shapiro-Wilk test, and correlations were assessed by Spearman’s exact test. Solid diamonds indicate the probucol 200 mg/kg/day administered macaque group. Open circles indicate the probucol 400 mg/kg/day administered macaque group.

