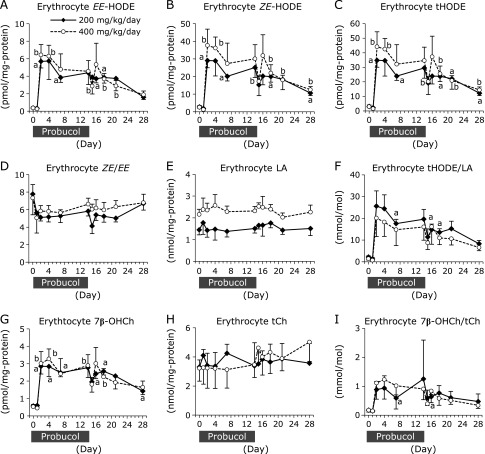
Fig. 4.
Changes in the levels of linoleic acid- and cholesterol-derived peroxidation products in erythrocytes. The erythrocyte concentrations of EE-HODE [the sum of 9-(E,E)-HODE and 13-(E,E)-HODE] (A), ZE-HODE [the sum of 13-(Z,E)- and 9-(E,Z)-HODE] (B) and total HODE (tHODE; the sum of 4-isomers of HODEs) (C) were measured by using LC-MS/MS. The ratio of ZE-HODE to EE-HODE (ZE/EE) in erythrocytes was calculated (D). The erythrocyte concentration of LA (E) was measured using GC-MS, and the ratio of tHODE in LA (tHODE/LA) was calculated (F). The erythrocyte concentrations of 7β-OHCh (G) and tCh (H) were measured by using GC-MS, and the ratio of 7β-OHCh in tCh (7β-OHCh /tCh) was calculated (I). Solid diamonds indicate the probucol 200 mg/kg/day administered macaque group. Open circles indicate the probucol 400 mg/kg/day administered macaque group. The data are expressed as mean ± SD. Statistical analysis was carried out using ANOVA. ap<0.05 and bp<0.05 compared to the initial (day 0) value for the same individual.

