
Figure 10.
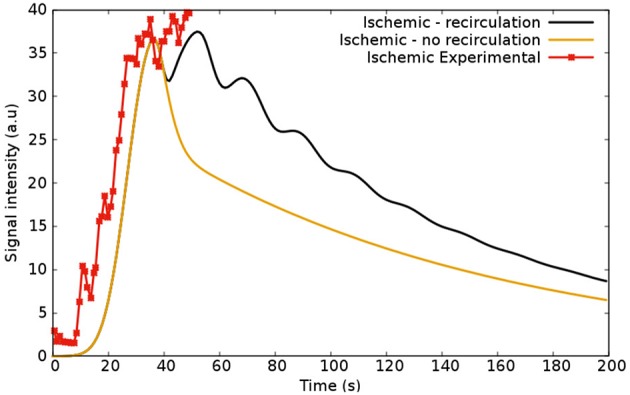
Simulations regarding ischemic scenarios: the first (black), shows the model coupled with the recirculation part (Equation 18) and the second (yellow), without it. The red curve shows the experimental data from Daly and Kwong (2013).
Official websites use .gov
A
.gov website belongs to an official
government organization in the United States.
Secure .gov websites use HTTPS
A lock (
) or https:// means you've safely
connected to the .gov website. Share sensitive
information only on official, secure websites.
Simulations regarding ischemic scenarios: the first (black), shows the model coupled with the recirculation part (Equation 18) and the second (yellow), without it. The red curve shows the experimental data from Daly and Kwong (2013).