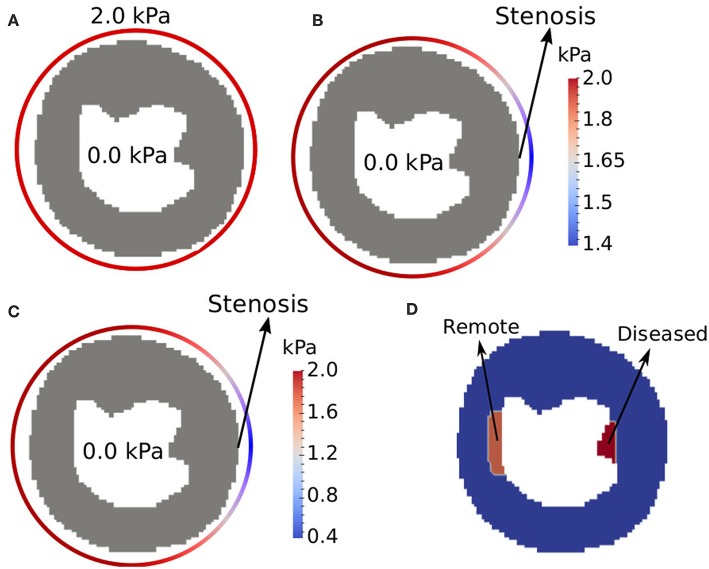
Figure 5.
Performed simulations: (A) healthy, (B) ischemic, and (C) infarct. (D) Shows the regions of interest for the evaluation of CA signal intensity. When simulating ischemia and infarct, we sum up the concentration of CA in these regions of interest, for each time instant. The colored circle that surrounds the epicardium represents the pressure boundary condition for each scenario. Note the different minimum values of the two color bars.

