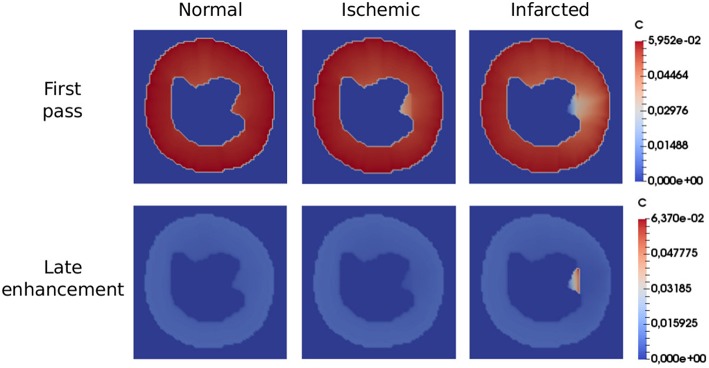
Figure 7.
Qualitative images in the end of first pass (50 s) and late enhancement (600 s) exams. In the first scenario (healthy), the CA is homogeneously distributed, while in the second (ischemia), the diseased region is revealed by low localized contrast values. At the time of late-enhancement, the CA gets stuck in the infarction region as reflected by the high localized contrast values. All the simulations reproduced well the characteristics seen by the clinicians in the considered scenarios.

