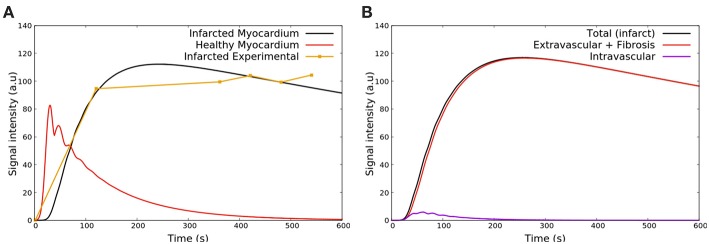
Figure 9.
(A) SI of the contrast agent in scenarios remote/healthy (red) and infarction (black). The yellow curve presents the clinical data taken from Knowles et al. (2008). The CA remains in the infarct area because it attaches to fibrosis, and thus takes longer to be washed out. (B) Contribution of both intra and extravascular spaces in the CA dynamics in the infarct region. The intravascular curve (purple) shows that the CA in this domain is quickly washed out, while the CA remains in the extravascular space (red curve) after 2 min.

