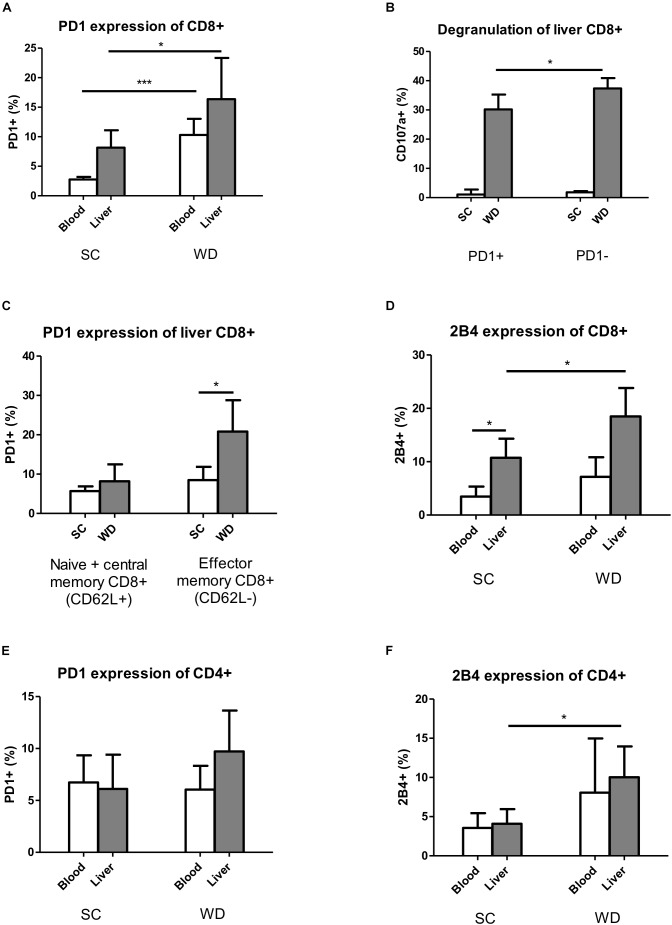
FIGURE 4.
Expression of inhibitory T cell receptors PD1 and 2B4 increases on hepatic T cells under WD. (A) Blood and intrahepatic PD1 expressing CD8+ cells were analyzed by Flow Cytometry after SC and WD feeding for 24 weeks. (n = 5, ∗p < 0.05 and ∗∗∗p < 0.001). (B) Percentage of intrahepatic degranulating CD107a+ CD8 T cells of PD1+ and PD1- cells after SC or WD treatment for 24 weeks. (n = 5, ∗p < 0.05). (C) Upregulation of PD1 on intrahepatic CD8+ CD62L+ (Naïve + central memory CD8+ T cells) and CD8+ CD62L- (effector memory CD8+ T cells) T cells after SC or WD. (n = 5, ∗p < 0.05). (D) 2B4 expression on CD8+ T cells in blood and liver after SC or WD feeding for 24 weeks. (n = 5, ∗p < 0.05). (E) PD1 expression on blood and hepatic CD4+ T cells under SC or WD for 24 weeks. (n = 5). (F) Inhibitory receptor 2B4 expression blood and intrahepatic CD4 T cells under SC or WD. (n = 5, ∗p < 0.05).

