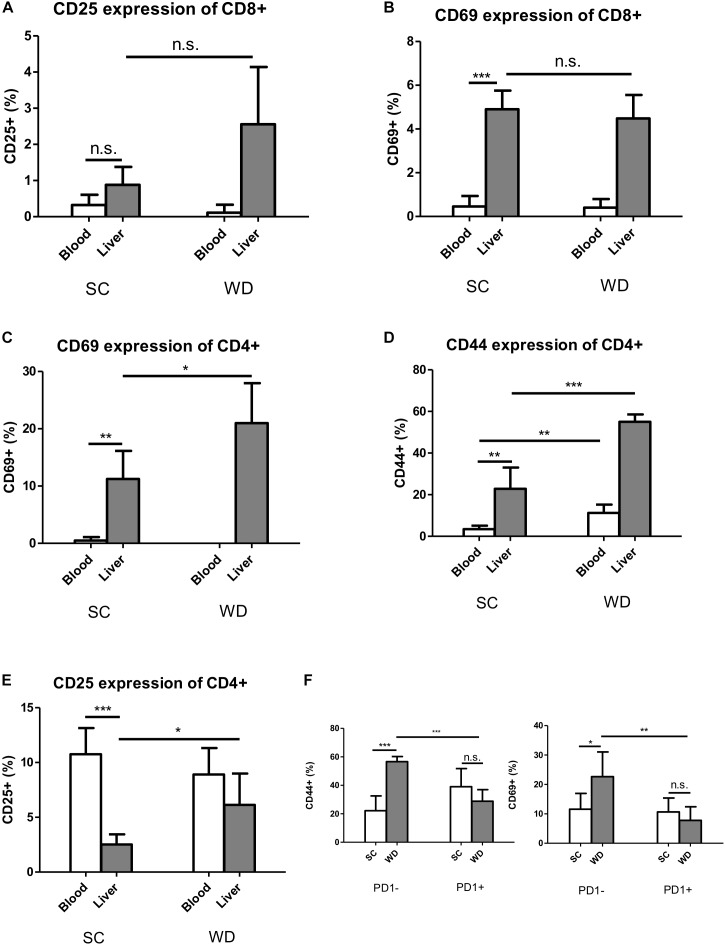
FIGURE 5.
Activation markers CD69 and CD44 are increased under metabolic stress on hepatic CD4 T cells, but not CD8 T cells, while this activation is inhibited in PD1+ CD4 T cells. (A) CD25 expression on blood and liver CD8 T cells under SC or WD for 24 weeks. (n = 5). (B) CD69 expression on blood and on hepatic CD8 T cells after 24 weeks treatment with SC or WD. (n = 5), (∗∗∗p < 0.001). (C) CD69 expression on blood and hepatic CD4 T cells after 24 weeks SC and WD feeding. (n = 5, ∗p < 0.05). (D) CD44 expression on blood and intrahepatic CD4 T cells under SC or WD treatment for 24 weeks. (n = 5, ∗∗p < 0.01 and ∗∗∗p < 0.001). (E) CD25 expression on blood and hepatic CD4 T cells under SC or WD. (n = 5), (∗p < 0.05 and ∗∗∗p < 0.001). (F) CD44 and CD69 expression on PD1+ or PD1- CD4 T cells after SC or WD feeding. (n = 5), (∗p < 0.05; ∗∗p < 0.01; and ∗∗∗p < 0.001).

