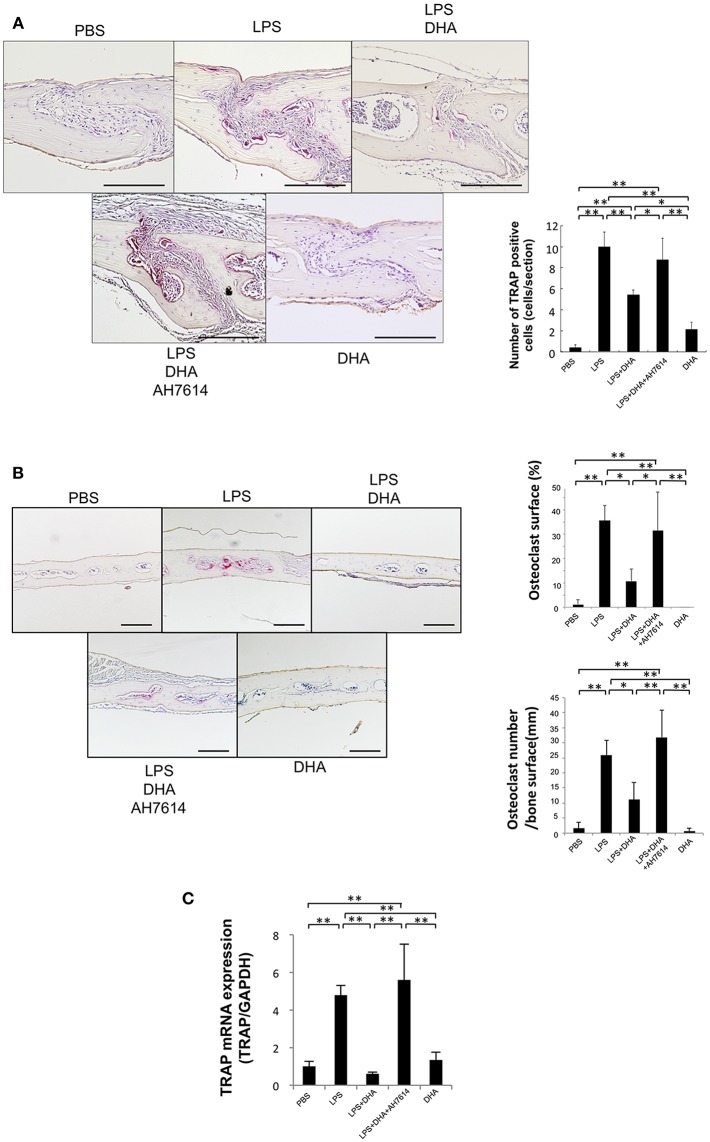
Figure 2.
DHA inhibits LPS-induced osteoclast formation via GPR120 activation in vivo. (A) Histological sections of calvariae were prepared from C57/BL6 mice following 5 days of supracalvarial administration of PBS, LPS (100 μg/day), LPS (100 μg/day)+DHA (100 μg/day), LPS (100 μg/day)+DHA (100 μg/day)+AH7614 (100 μg/day), or DHA (100 μg/day). Sections were stained with TRAP solution and hematoxylin for counterstaining was performed. TRAP-positive cells appeared dark red. Scale bars = 100 μm. Numbers of TRAP-positive cells in the suture mesenchyme of calvariae from mouse groups administered PBS, LPS, LPS+DHA; LPS+DHA+AH7614 or DHA. Data are shown as means ± SD. Statistical significance was determined by Scheffe's test (n = 4; **p < 0.01, *p < 0.05). (B) Histological sections of calvariae after 5 days of daily supracalvarial administration of PBS, LPS (100 μg/day), LPS (100 μg/day)+DHA (100 μg/day), LPS (100 μg/day)+DHA (100 μg/day)+AH7614 (100 μg/day), or DHA (100 μg/day). Sections were stained with TRAP solution and hematoxylin for counterstaining was performed. The percentage of interface of bone marrow space covered by osteoclast and the number of TRAP-positive cells per millimeter of interface of bone marrow space were evaluated. Data is expressed as means ± standard deviation (SD). Statistical significance was determined by Scheffe's test (n = 4; **p < 0.01 *p < 0.05). (C) Expression levels of TRAP mRNA in calvariae of the mouse groups determined by real-time RT-PCR analysis. Data are expressed as means ± SD. Statistical significance was determined by one-way ANOVA and Turkey-Kramer tests (n = 4; **p < 0.01, *p < 0.05).

