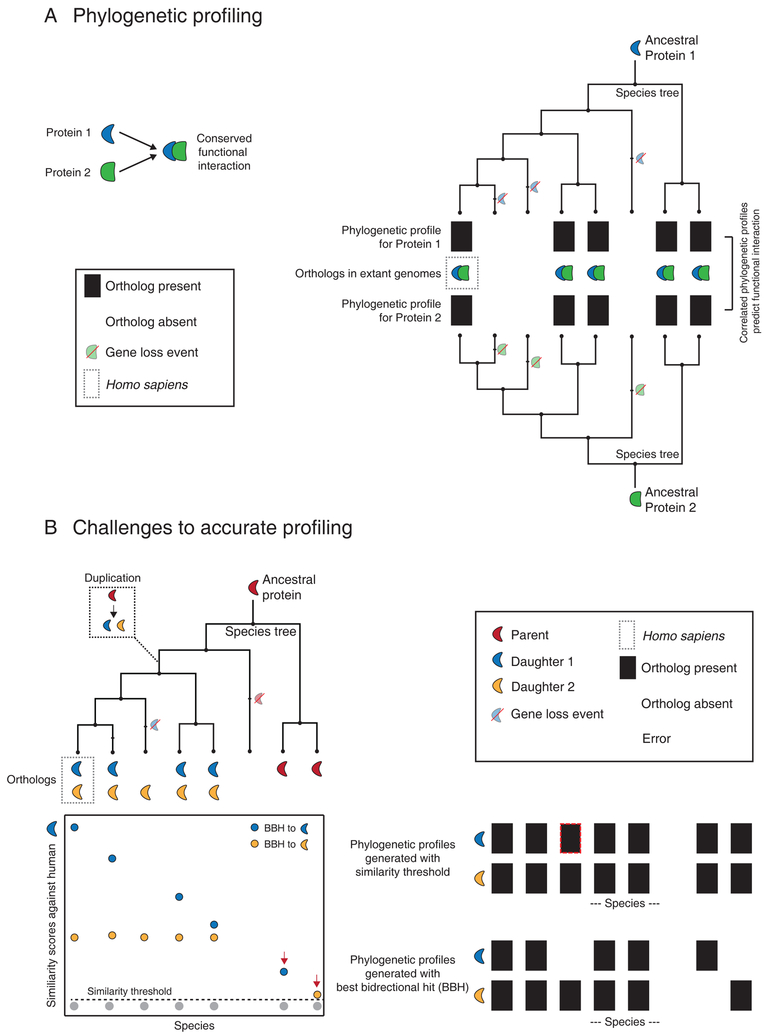
Figure 1. Phylogenetic profiling and its challenges.
(A) This schematic illustrates the method of phylogenetic profiling using homologs (orthologs) mapped across 8 species that are related through the accompanying species tree. Protein 1 and 2 interact functionally and share identical homolog (ortholog) distributions, with each potential ortholog represented in a binary phylogenetic profile with a 1 (black) if present or a 0 (white) if absent. Inferred gene loss events are highlighted on the tree. The correlated phylogenetic profiles for Proteins 1 and 2 can be used to predict the conserved functional interaction. (B) Challenges to phylogenetic profiling. In this illustration, an ancestral protein duplicates once (box inset), leading to a complex distribution of orthologs in different extant species. The graph below the species tree represents a theoretical distribution of similarity scores (e.g. BLAST) generated against human protein 1. Each point (a putative ortholog in each species) is color-coded in accordance with its reciprocal best match in the human genome (BBH; best bidirectional hit). Species branching off before the duplication event contain only one homolog resulting in an artifact-prone BBH match (red arrows). The dotted line represents a suitable homology threshold. Phylogenetic profiles are generated using either this homology threshold (top) or a best bidirectional hit criterion (BBH, bottom) in each species. Errors in the phylogenetic profiles resulting from each method are highlighted with red dotted lines.

