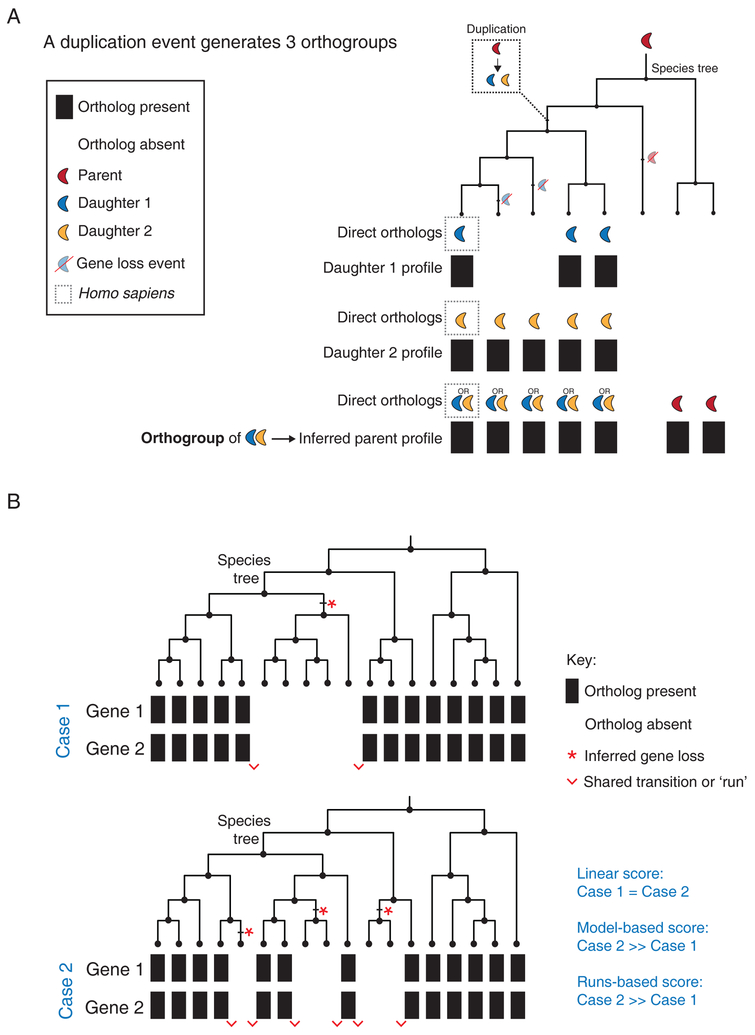
Figure 2. Improvements to phylogenetic profiling.
(A) The schematic illustrates the use of an orthogroup strategy to resolve a single gene duplication event. First, phylogenetic profiles are generated for Daughter 1 and Daughter 2 using a BBH criterion in species that branched off after the duplication event. Next, an orthogroup (group of co-orthologs or sister genes) is created that contains the two human proteins Daughter 1 and Daughter 2. A third phylogenetic profile can now be generated that assigns an ortholog to a species that contains a BBH match to either Daughter 1 or Daughter 2. (B) Schematic to illustrate the strengths and weaknesses of common algorithms used to quantify the strength of coevolution between phylogenetic profiles using two different evolutionary scenarios (Case 1 and 2) for Gene 1 and Gene 2. In both scenarios, phylogenetic profiles for Gene 1 and Gene 2 are being compared across 18 species related through the accompanying species tree. The total number of shared profile presence calls (13) and absence calls (5) are identical in each case. Case 2 contains more inferred loss events (red stars) and shared transitions between phylogenetic profiles (red wedges). Blue text indicates the relative strength of coevolution assessed by linear, model-based and runs-based algorithms for these two scenarios.

