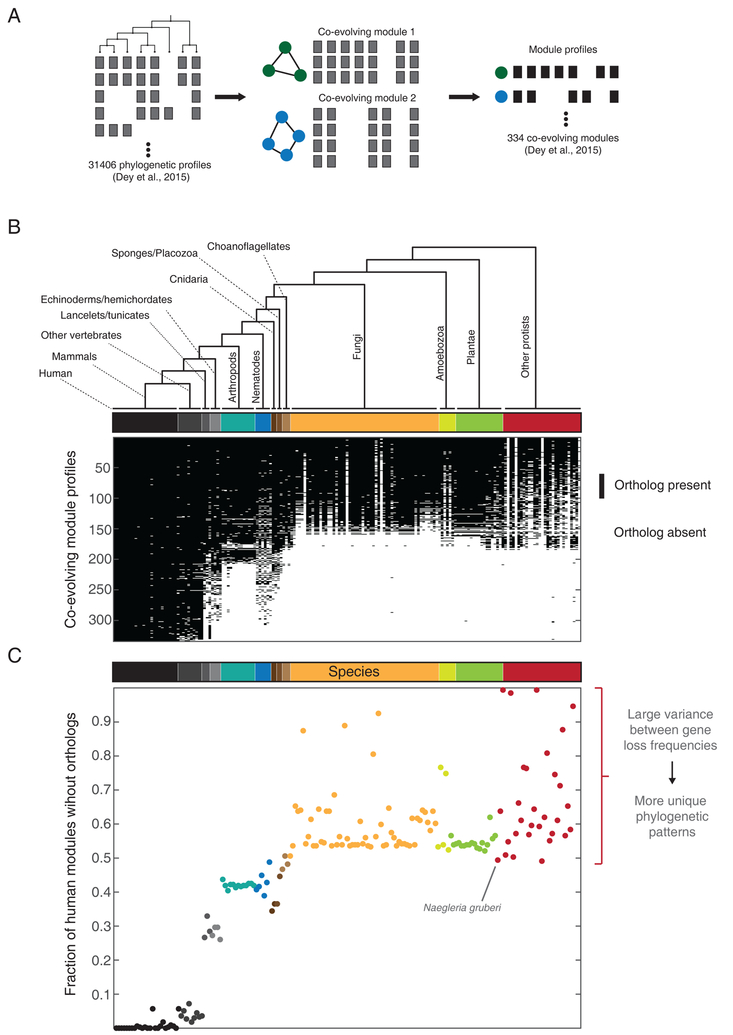
Figure 3. Species contributing to informative phylogenetic profiles.
(A) Schematic illustrating the generation of co-evolving modules. Phylogenetic profiles of all human genes and orthogroups (Dey et al., 2015) were clustered using an agglomerative algorithm to generate 334 modules containing 3 or more components (illustrated using two modules containing 3 and 4 components respectively with phylogenetic profiles in gray). An averaged binary phylogenetic profile was generated for each module (black).
(B) Averaged module phylogenetic profiles spanning 177 eukaryotic species ordered by 13 major branches, represented using text labels as well a color bar (the complete list of species can be found in Figure S1 of Dey et al., 2015). Each binary profile represents the consensus (averaged, 1:black, 0:white) for each one of the 334 strongly coevolving modules. (C) The fraction of modules missing or lost in each species, estimated from (A). Each point represents 1–(sum of column in (A)), color coded in accordance with the species tree. Groups of species populating the same branch with a mixture of low and high loss fractions (big spread on y-axis) contribute strongly to the identification of coevolving modules through informative lineage-specific gene losses.

