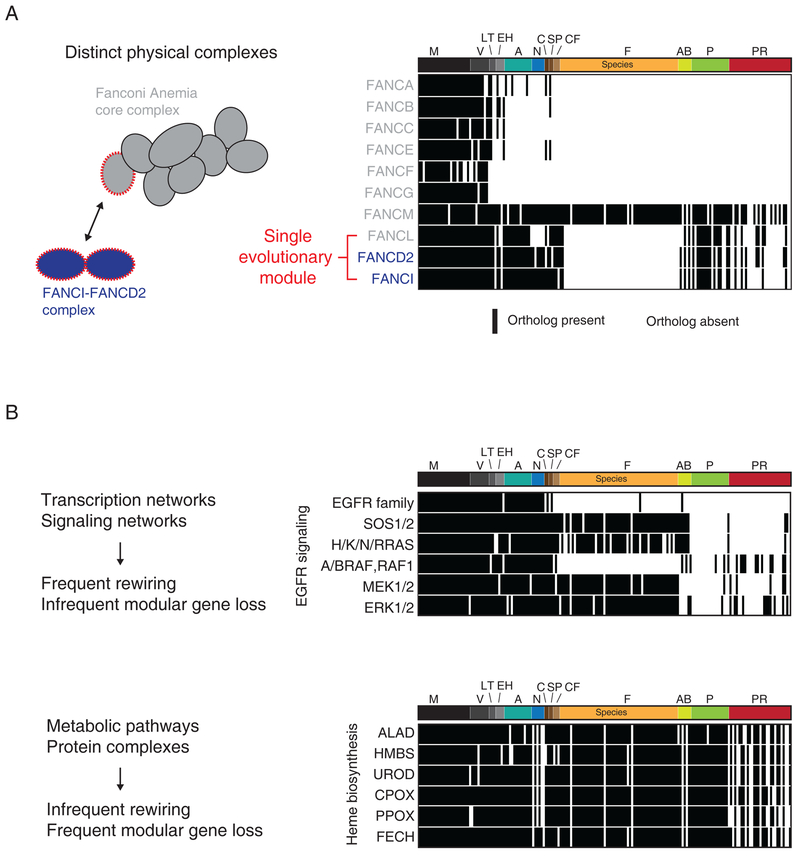
Figure 4. Evolutionary modularity.
(A) Left, schematic illustrating the components of two interacting physical complexes involved in the Fanconi Anemia pathway. Right, phylogenetic profiles for each protein in the two complexes 1:black, 0:white). Data from Dey et al. 2015. A red font is used to illustrate the coevolving phylogenetic module. Abbreviations for species branches: M: Mammals, V: Other Vertebrates, LT: Lancelets/Tunicates, EH: Echinoderms/Hemichordates, A: Arthropods, N: Nematodes, C: Cnidaria, SP: Sponges/Placozoa, CF: Choanoflagellates, F: Fungi, AB: Amoebozoa, P: Plantae, PR: Other protists. (B) Top, phylogenetic profiles for 6 proteins/ protein families involved in canonical EGFR signaling. Bottom, phylogenetic profiles for 6 enzymes involved in heme biosynthesis. Data from Dey et al. 2015. Species ordered as in (A).

