
Figure 5.
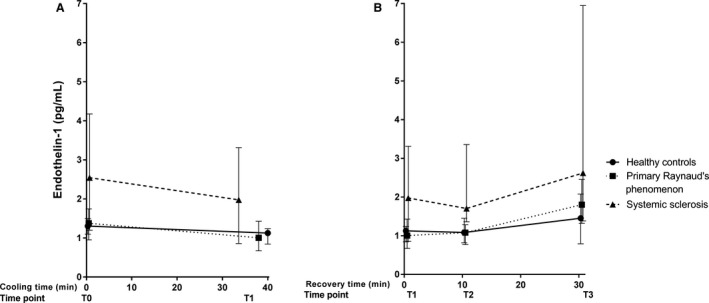
Median (and IQR) concentration of endothelin‐1 during cooling (A) and recovery (B). Measurements at four different time points during a standardized cooling and recovery experiment in healthy controls (n = 10 at all time points), primary Raynaud (n = 10 during cooling, n = 9·10 min after start recovery and n = 8 at the end of recovery) and systemic sclerosis patients (n = 10 during cooling and 10 min after start recovery, n = 9 at the end of recovery). During cooling: HC: Δ = −0.18 [−0.25 to −0.26]; PRP: Δ = −0.37 [−0.28 to −0.31]; SSc: Δ = −0.56 [−0.34 to −0.86]. During recovery: HC Δ = 0.33 [−0.05–0.84]; PRP Δ = 0.79 [0.64–1.02]; SSc Δ = 0.64 [0.52–3.63].