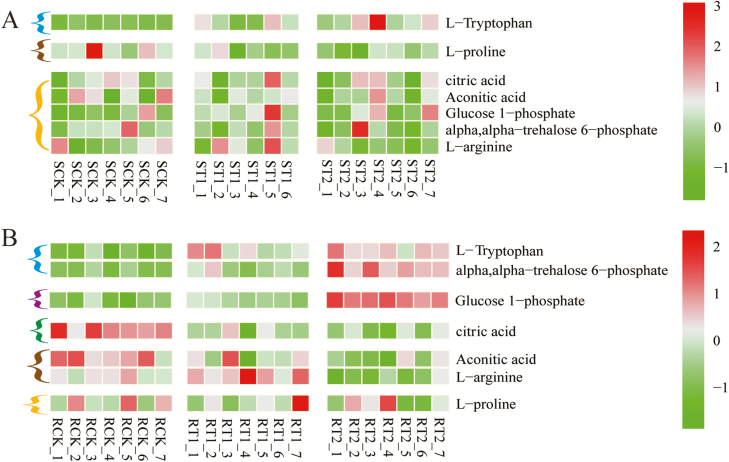
Fig. 2.
Metabolomics heat map based on LC-MS secondary mass spectrometry. The color gradient illustrates the Z-scores of seven metabolites in the shoot (A) and root (B), calculated as the mean-centered normalized intensity values divided by the SD for each metabolite. SCK, ST1, and ST2 indicate the metabolites in the shoots of plants exposed to sole NO3–, mixed N, and sole NH4+ supply, respectively. RCK, RT1, and RT2 indicate the metabolites in the root of plants exposed to sole NO3–, mixed N, and sole NH4+ supply, respectively. Seven repeats were performed for each N treatment. Significant difference for each metabolite was defined as P<0.05 and fold change ≥1.5 or ≤0.66. Compared with the effects of sole NO3– supply, the concentration of metabolites is either increased by both mixed N and sole NH4+ supply (blue bracket), increased by only sole NH4+ supply (purple bracket), reduced by both mixed N and sole NH4+ supply (green bracket), reduced by only sole NH4+ supply (brown bracket), or does not differ among the treatments (orange bracket).

