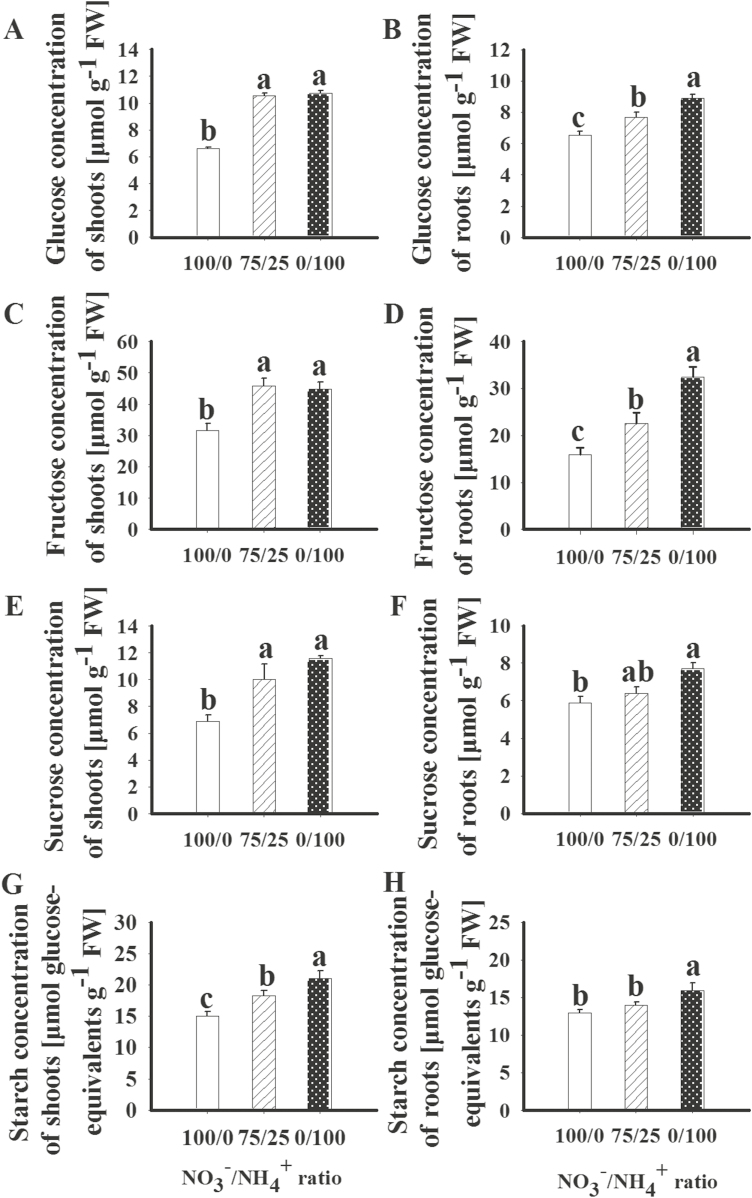
Fig. 7.
Concentrations of glucose (A, B), fructose (C, D), sucrose (E, F), and starch (G, H) in the shoots and roots of maize plants grown in the presence of different forms of N. 100/0, sole NO3– supply; 75/25, 75%/25% NO3–/NH4+; 0/100, sole NH4+ supply. Values are mean ±SE (n=7). Significant differences between treatments (P<0.05) are indicated with different letters.

