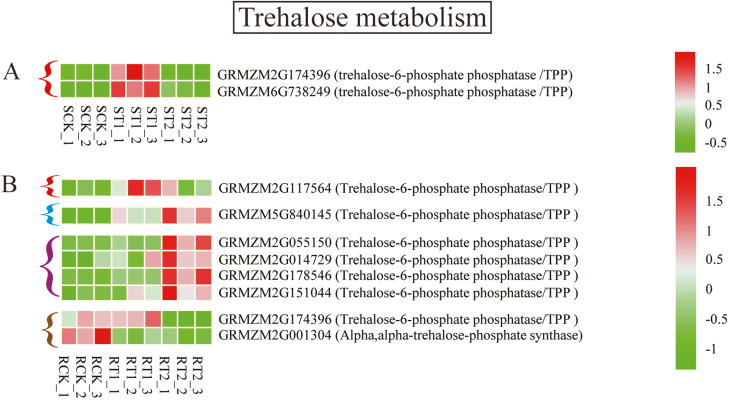
Fig. 8.
Transcriptome heat map for differentially expressed genes of trehalose metabolism in the shoot (A) and root (B). SCK, ST1, and ST2 indicate the levels of gene expression in the shoot of plants exposed to sole NO3–, mixed N, and sole NH4+ supply, respectively. RCK, RT1, and RT2 indicate the levels of gene expression in the root of plants exposed to sole NO3–, mixed N, and sole NH4+ supply, respectively. Three repeats were performed for each N treatment. The color gradient illustrates the Z-scores of the gene expression values calculated as the mean-centered log2 (FPKM) values divided by the SD for each gene. Significant difference for each gene was defined as P<0.05 and log2 (FPKM) values ≥1 or ≤–1. Compared with expression in the presence of sole NO3– supply, the expression of genes is either up-regulated by mixed N supply (red bracket), up-regulated by both mixed N and sole NH4+ supply (blue bracket), up-regulated by sole NH4+ supply (purple bracket), or down-regulated by sole NH4+ supply (brown bracket).

