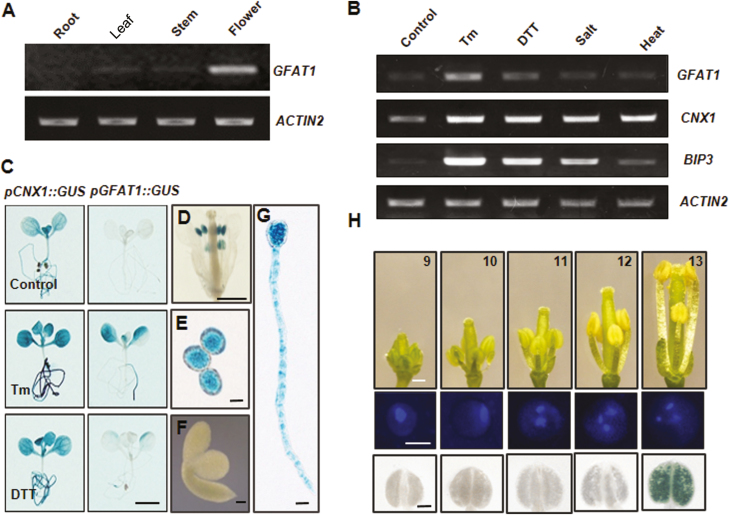
Fig. 1.
Expression analysis of AtGFAT1. (A) RT-PCR analysis of AtGFAT1 in roots, leaves, stems, and flowers from wild-type plants. (B) RT-PCR analysis of AtGFAT1 in wild-type plants after various stress treatments. Total RNAs were extracted from 2-week-old seedlings treated for 24 h with 50 ng ml−1 Tm, 1 mM DTT, 100 mM NaCl (salt), or 37 °C (heat). AtCNX1 and AtBIP3 were used as ER stress controls and ACTIN2 was used as an internal normalization control. (C) Histochemical analysis for 10-day-old seedlings of transgenic plants harboring pGFAT1::GUS or pCNX1::GUS construct treated for 24 h at 50 ng ml−1 Tm or 1 mM DTT. The same transgenic plants grown under normal conditions were used as a control. (D–G) GUS staining for pGFAT1::GUS expression at different developmental stages: mature flower (D), pollen grains (E), embryo of germinating seed (F), and pollen tubes (G). Different stages of flowers from pGFAT1::GUS transgenic lines were sampled for GUS staining (H). Flowers were laid out in order of developmental stages as indicated by the numbers (top). Representative pollen grains (middle) and anthers (bottom) are shown. Scale bars: 3 mm (C), 0.5 mm (D), 0.2 mm (F), 10 µm (E, G), 0.5 mm (H, top), 10 µm (H, middle), 1 mm (H, bottom).

