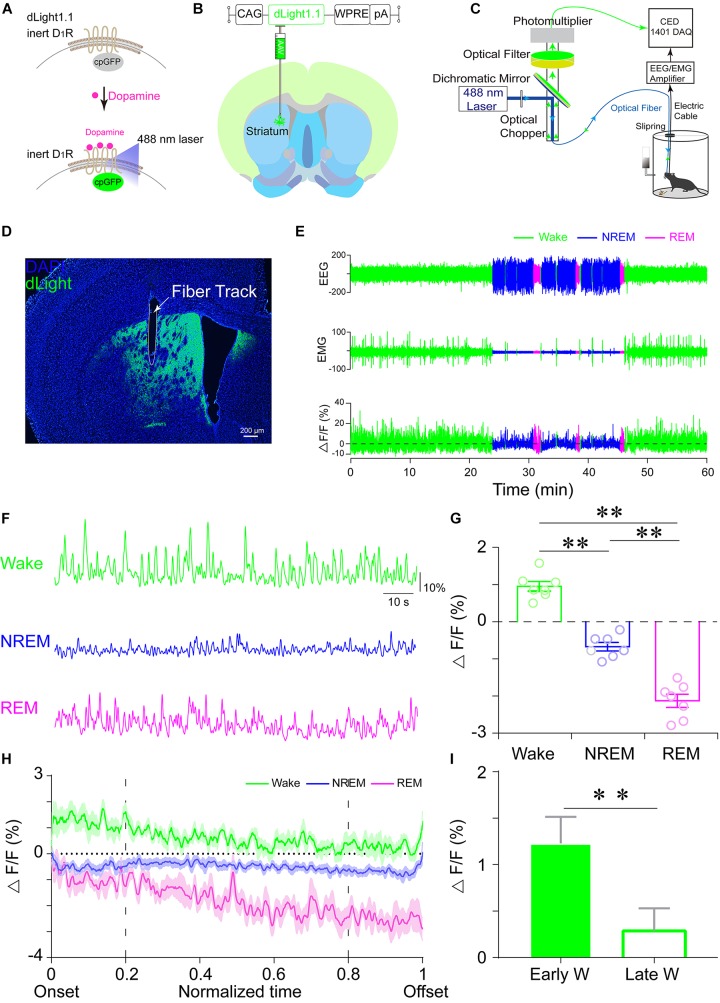
FIGURE 1.
Striatal dLight1.1 signals at distinct spontaneous sleep–wake states. (A) Schematic diagram of dLight1.1 with the dopamine D1 receptor and circularly permuted GFP (cpGFP) module (upper panel) and the working principle of dLight1.1. (B) Schematic showing the injection of AAV-CAG-dLight1.1 into the dorsal striatum. (C) Schematic showing the setup for fiber photometry used to assess dLight1.1 fluorescence with simultaneous polysomnographic recordings. (D) Expression of dLight1.1 in the dorsal striatum. The scale bar is 200 μm. (E,F) Representative EEG, EMG, and fluorescent photometry signal traces of striatal dLight1.1. during distinct sleep–wake states (green, wake; blue, NREM sleep; magenta, REM sleep). (G) Quantification of the average striatal dLight1.1 signal at distinct sleep–wake states. One-way ANOVA: F2,18 = 116.1, P < 0.0001; Tukey’s post hoc test: wake vs. NREM sleep ∗∗P < 0.0001, wake vs. REM sleep ∗∗P < 0.0001, NREM vs. REM sleep ∗∗P < 0.0001; n = 7 mice. (H) Temporal dynamics of the striatal dLight1.1 signal during long-term wake (green), NREM sleep (blue), and REM sleep (magenta) episodes within normalized time. (I) Striatal dLight1.1 signal at the early wake period (first 20% of wake period) and the late wake period (last 20% of wake period) (t6 = 5.058, ∗∗P = 0.0023, n = 7 mice).

