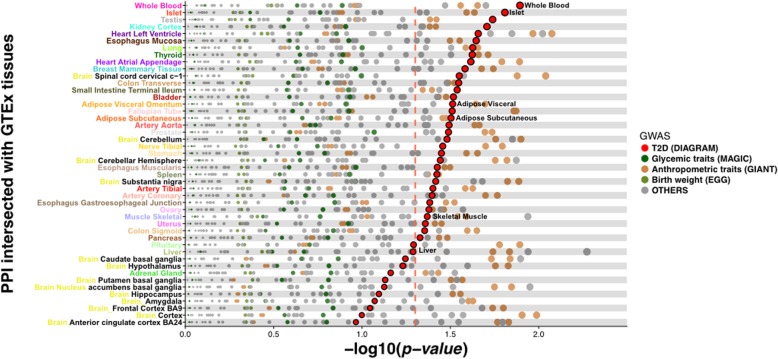
Fig. 3.
GWAS signal enrichment in tissue-specific interactomes. RNA-Seq data was used to filter the overall InWeb3 network and generate in silico tissue-specific networks that maximise connectivity between GWAS interval genes. Linking nodes within these networks were then tested for enrichment for GWAS signals using a permutation scheme. Each dot in the figure depicts the −log10 p value for enrichment for signals in a given GWAS dataset, for each of the 46 tissues. Dot colours reflect the GWAS phenotypes with T2D in the larger red colour. The dotted red line represents the nominal value of significance (p = 0.05), calculated as the empirical estimate of the null distribution from which the p value has been drawn. Islet showed the second strongest enrichment signal for T2D

